Figure 3.
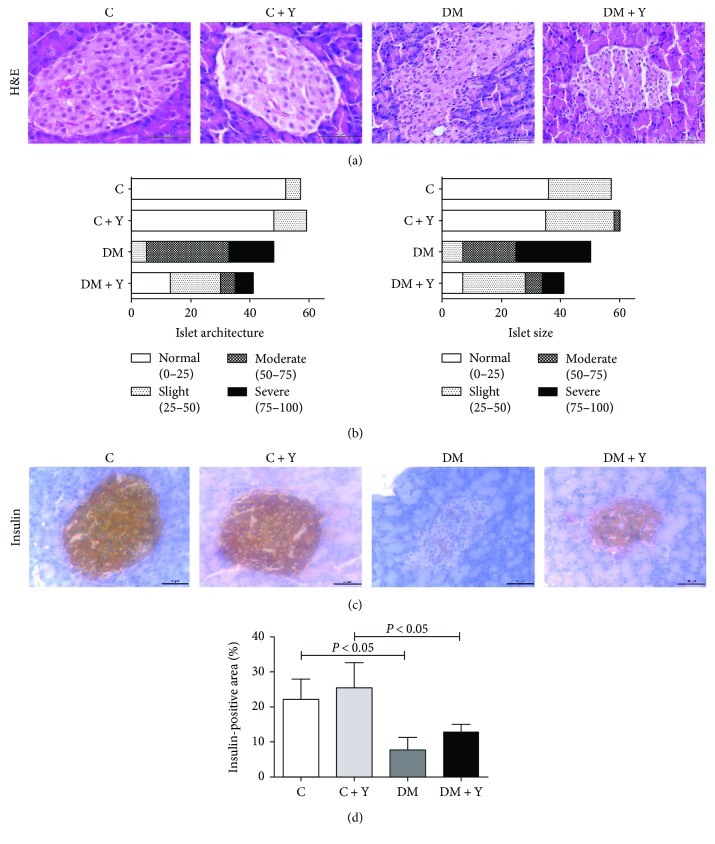
Pancreatic histology, pathologic scoring, and immunohistochemistry analysis. (a) Pancreas histological sections stained with hematoxylin and eosin. (b) Pancreas scoring among groups using architecture and islet size as parameters. (c) Histological analysis of the pancreas by immunohistochemistry for insulin. (d) Quantitative analysis of the positive area for insulin in the pancreatic islets quantified using the imaging software ImageJ. Original magnification, ×20. Scale bars, 50 μm. The data represent the mean ± standard deviation. Statistical analysis was performed using the generalized linear model and two-way analysis of variance test complemented with a nonparametric test for the insulin-positive area or the generalized linear model (binomial) followed by the Wald test for scoring analysis. Significance were represented by P values. C: controls; C + Y: controls treated with Yacon leaf extract; DM: diabetic controls; DM + Y: diabetic rats treated with Yacon; H&E: hematoxylin and eosin.

