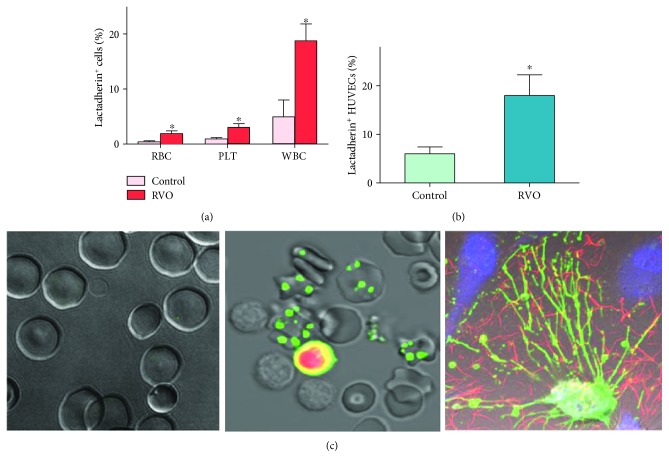
Figure 2.
Flow cytometry and confocal microscopy of PS exposure on the plasma membrane. (a, b) Lactadherin-binding number of PLT, RBC, and WBC both in the control group (n = 25) and in the RVO group (n = 25) was measured. Data are displayed as the mean ± SD. ∗P < 0.001 versus controls. (c) Confocal microscopy images of normal erythrocytes (left), apoptotic erythrocytes and leukocytes in the RVO group stained with lactadherin (green) and PI (red) (middle) and ECs activated with RVO serum (lactadherin green; DAPI blue; fibrin red) (right) (n = 6).

