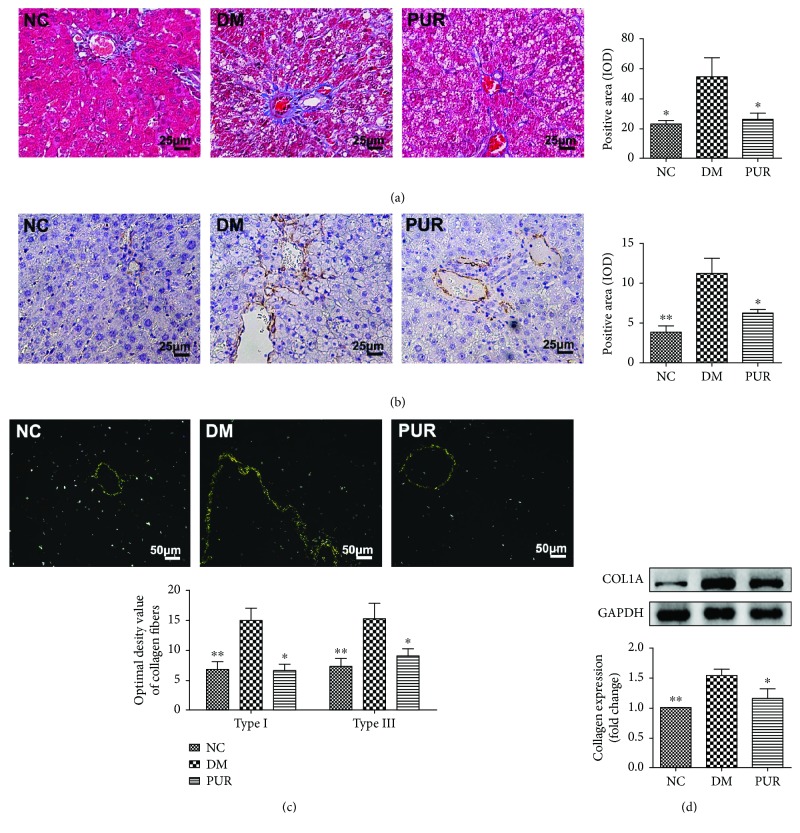
Figure 4.
PUR hindered diabetic liver fibrosis and excessive ECM production. (a) Representative picture of liver fibrosis by Masson staining magnified by 400x, and the quantitative results of positive area assessed by ImageJ. (b) Immunohistochemical staining of α-SMA, magnified by 400x, and the quantitative results of α-SMA staining. (c) Picric acid-Sirius red staining of liver collagen fibers, magnified by 100x and 200x, and the quantitative results of type I and III collagens. Data are mean ± SEM, n = 5 per group. (d) Western blot analysis for COL1A1 expression in the liver. Data are mean ± SEM. n = 6 per group, replicated twice. ∗p < 0.05 and ∗∗p < 0.01 compared versus DM.

