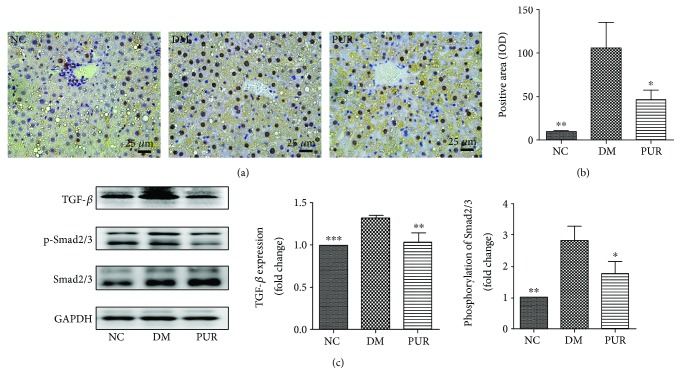
Figure 8.
The inhibition of PUR on TGF-β induced Smad2/3 signaling pathway activation. (a) Immunohistochemical staining of TGF-β, magnified by 400x. (b) Quantitative results of TGF-β staining assessed by ImageJ. Data are presented as mean ± SEM, n = 5 per group. (c) Western blot analysis for TGF-β protein expression and phosphate Smad2/3 in liver tissue. Data are presented as mean ± SEM, n = 8 per group, replicated twice. ∗p < 0.05, ∗∗p < 0.01, and ∗∗∗p < 0.001 compared versus DM.

