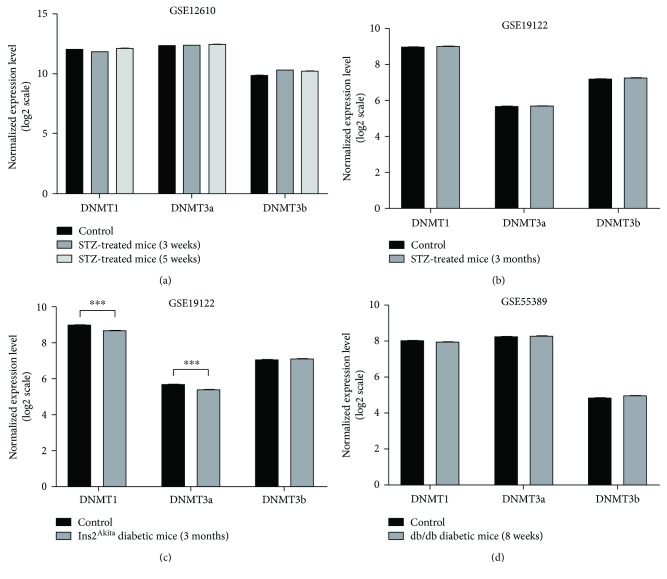
Figure 1.
Comparison of DNMT expression using GEO datasets of microarray profiling in mouse models of diabetic retinopathy. (a) Comparison of retinal DNMT expression between adult CD1 streptozotocin- (STZ-) induced diabetic mice (3-week and 5-week) and age-matched controls (4 retinas for each group were pooled) using the GSE12610 dataset. (b) Comparison of retinal DNMT expression between eight C57BL/6J STZ-induced diabetic mice, after 3 months of hyperglycaemia, and eight controls, using the GSE19122 dataset. (c) Comparison of retinal DNMT expression between nine insulin-deficient Ins2Akita mice, after 3 months of hyperglycaemia, and eight controls, using the GSE19122 dataset. (d) Comparison of retinal DNMT expression between four 8-week-old db/db diabetic mice and four age-matched lean nondiabetic controls, using the GSE55389 dataset. ∗∗∗ p < 0.001.

