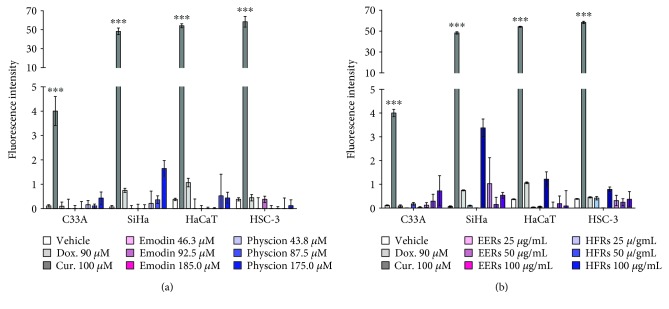
Figure 5.
Caspase 3 activity assay. SiHa, C33A, HSC-3, and HaCaT after treatment for 6 h with (a) emodin, physcion and (b) EERs and HFRs. Results are expressed as mean cell fluorescence intensity of three independent experiments ± standard error (M ± SE), analyzed by one-way ANOVA with Tukey's post-test (statistically significant difference compared to vehicle control group: ∗∗∗p ≤ 0.001).

