Figure 16.

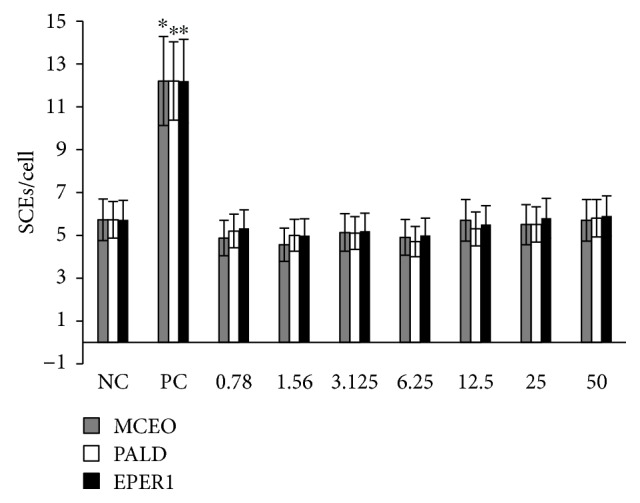
SCE frequencies after treatment with MCEO, PALD, and EPER1 in human lymphocytes. NC: negative control, PC: positive control (mitomycin C, 10−7 M). ∗p < 0.05, compared to NC.

SCE frequencies after treatment with MCEO, PALD, and EPER1 in human lymphocytes. NC: negative control, PC: positive control (mitomycin C, 10−7 M). ∗p < 0.05, compared to NC.