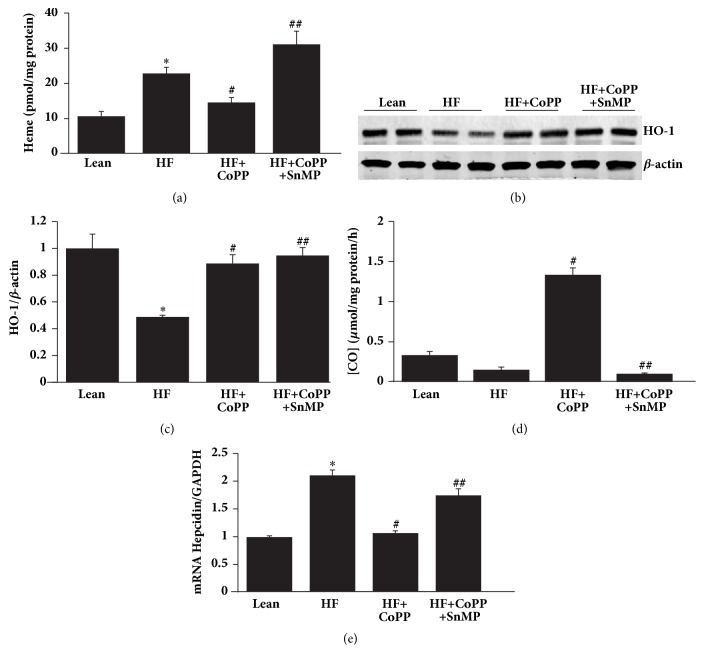
Figure 3.
Increase of HO-1 decreases heme levels and hepcidin expression. (a) Heme (pmol/mg protein) content, (b) representative western blots of HO-1, (c) densitometry analysis of HO-1 and (d) CO production (μmol/mg protein/h), and (e) mRNA expression of hepcidin in hepatic tissues of control lean mice, HF fed mice, HF fed mice + CoPP, and HF fed mice + CoPP + SnMP. Results are mean ± SE, n=6, ∗p<0.05 versus lean mice, #p<0.05 versus HF fed mice, and ##p<0.05 versus HF fed mice treated with CoPP.

