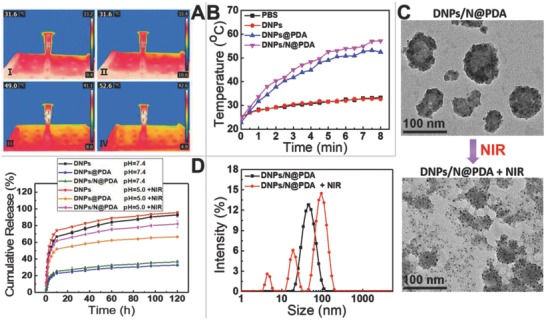
Figure 3.

A) Infrared thermographic images at 5 min of NIR laser irradiation (808 nm, 5 W cm−2), (A‐I) PBS, (A‐II) DNPs, (A‐III) DNPs@PDA, (A‐IV) DNPs/N@PDA. B) Temperature elevation curves of PBS, DNPs, DNPs@PDA, and DNPs/N@PDA with NIR laser irradiation of 808 nm at a power density of 5 W cm−2 for 8 min. C) TEM images of DNPs/N@PDA and NIR‐irradiated DNPs/N@PDA, and the hydrodynamic diameters of DNPs/N@PDA before and after NIR laser irradiation (808 nm, 5 W cm−2) for 5 min. D) Cumulative release profiles of DOX from DNPs, DNPs@PDA, and DNPs/N@PDA in PBS with different pHs without or with NIR irradiation (808 nm, 5 W cm−2, 5 min).
