
Figure 4.
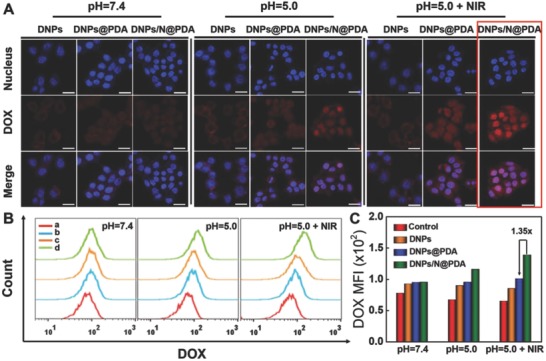
A) Confocal fluorescence images of HeLa cells exposed to DNPs, DNPs@PDA, and DNPs/N@PDA for 4 h at pH 7.4, pH 5.0, and pH 5.0 + NIR, respectively. Scale bars: 25 µm. B) Flow cytometric profiles of HeLa cells after treated by different samples for 4 h at pH 7.4, pH 5.0, and pH 5.0 + NIR, respectively. The concentration of DOX was fixed at 5 µg mL−1. a: negative control, b: DNPs, c: DNPs@PDA and d: DNPs/N@PDA. C) Quantification analysis of DOX fluorescence intensity in HeLa cells after incubation for 4 h at pH 7.4, pH 5.0, and pH 5.0 + NIR, respectively. NIR irradiation: 808 nm, 5 min at 5 W cm−2.