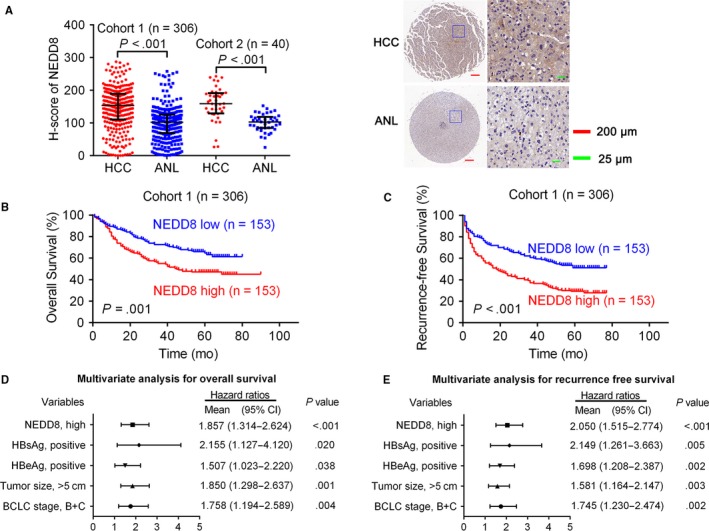
Figure 1.

Activation status of NEDD8 in HCC. A, IHC stains of NEDD8. (Left) H‐score of NEDD8 in 346 pairs of HCC and ANL tissues. (Right) Representative samples. Horizontal lines represent the medians, and whiskers represent the 25th and 75th percentiles. The Wilcoxon signed‐rank test was used. B, C, The Kaplan‐Meier analysis of the overall survival and disease‐free survival of patients with HCC according to the expression of NEDD8 in HCC tissues. The log‐rank test was used. D, E, Multivariate analysis of hazard ratios for overall survival and disease‐free survival is shown
