
Figure 1.
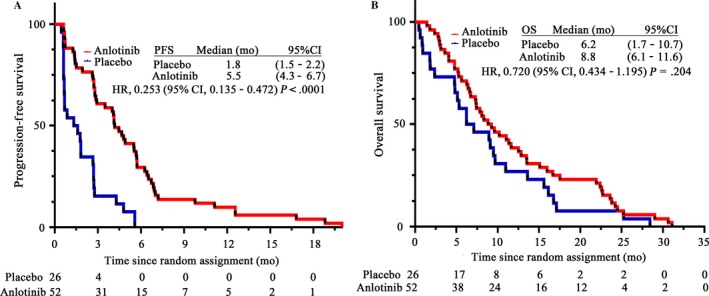
Kaplan‐Meier and Cox regression model analysis of PFS and OS between placebo and anlotinib group. A, PFS of the two groups. B, OS of the two groups. HR, hazard ratio; PFS, progression‐free survival; OS, overall survival
Official websites use .gov
A
.gov website belongs to an official
government organization in the United States.
Secure .gov websites use HTTPS
A lock (
) or https:// means you've safely
connected to the .gov website. Share sensitive
information only on official, secure websites.
Kaplan‐Meier and Cox regression model analysis of PFS and OS between placebo and anlotinib group. A, PFS of the two groups. B, OS of the two groups. HR, hazard ratio; PFS, progression‐free survival; OS, overall survival