
Figure 3.
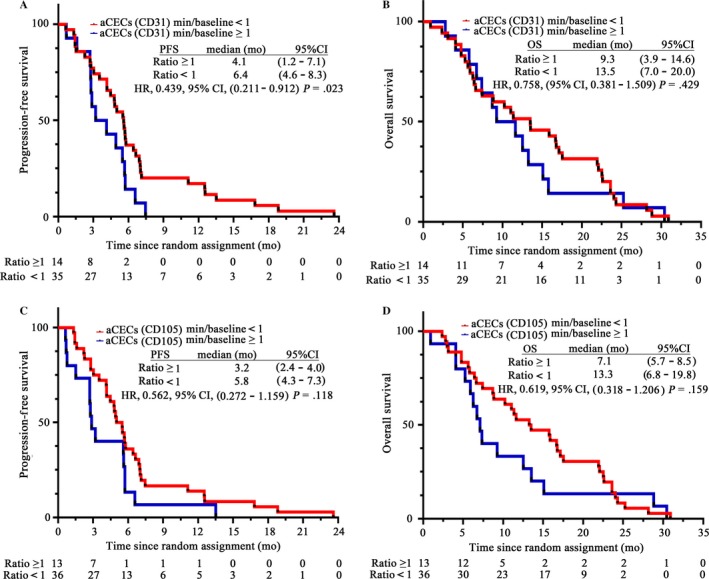
Analysis of PFS and OS in anlotinib group with a cutoff value of aCECs min/baseline = 1. A, PFS of CD31‐labeled aCECs min/baseline <1 and aCECs min/baseline ≥1 group. B, OS of the two groups. C, PFS of CD105‐labeled aCECs min/baseline <1 and aCECs min/baseline ≥1 group. D, OS of the two groups. PFS, progression‐free survival; OS, overall survival. aCECs, activated circulating endothelial cells