Figure 1.

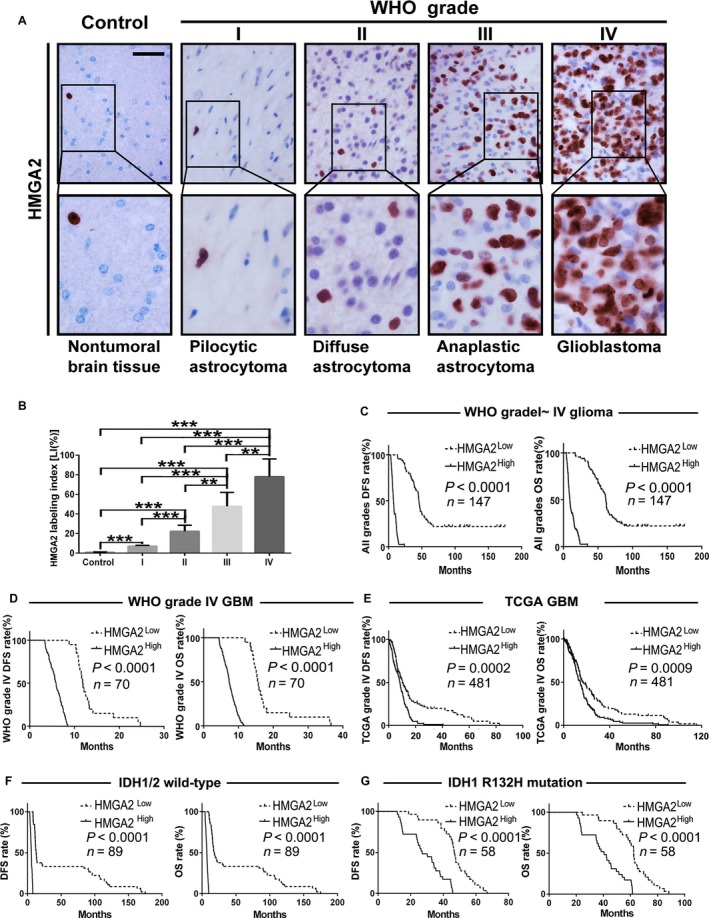
HMGA2 expression is correlated with both glioma grade and patient prognosis. A, HMGA2 IHC staining in the FFPE samples of 147 gliomas (n = 147) and 20 nonmalignant brain tissues (n = 20); scale bar = 50 μm. B, Quantification of the HMGA2 expression level (LI) among the different groups of the above brain tissue collection. The calculation of HMGA2 LI was defined in Section 2. The data are given as the mean ± SD. **, P < .01; ***, P < .001. C,D, The relationship between HMGA2 protein expression and DFS (left) or OS (right) of glioma patients of all grades (C, n = 147) and WHO grade IV GBM (D, n = 70) patients was analyzed by Kaplan‐Meier method. E, Survival test analyzed the effect of the HMGA2 level on DFS and OS of GBM patients from the TCGA dataset, n = 481. F‐G, Survival test analyzed the effect of HMGA2 protein expression on the DFS and OS of our glioma samples with wild‐type (F, n = 89) or R132H‐mutated IDH1 (G, n = 58). The medians of the HMGA2 levels were used to stratify the low‐ and high‐expression subgroups in all of the above survival analyses
