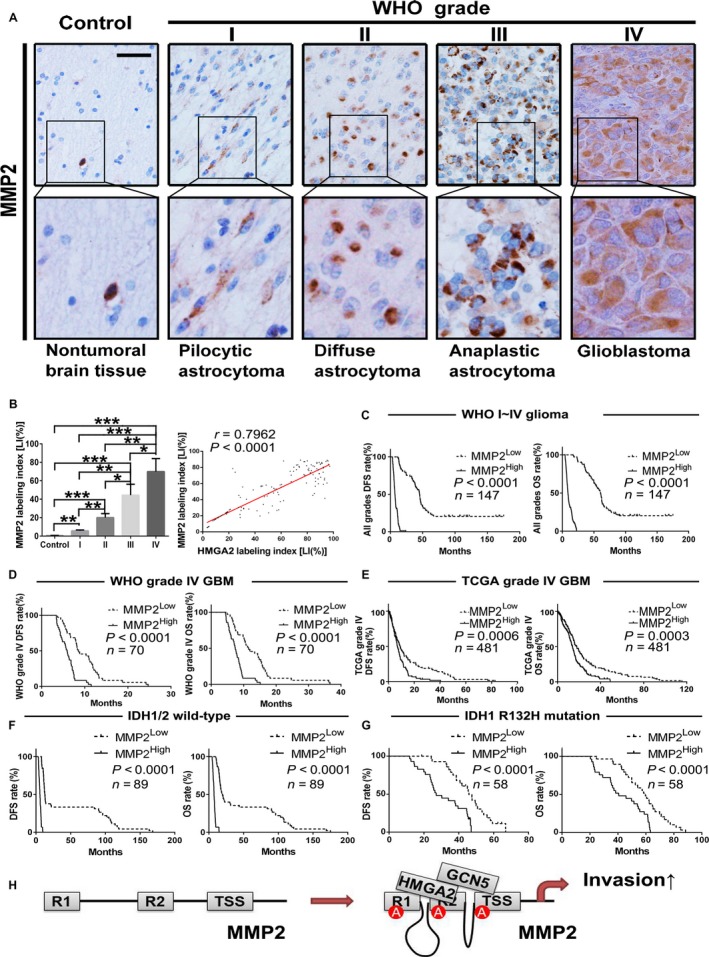
Figure 7.

MMP2 expression correlates with glioma grades, HMGA2, and patient prognosis. A, IHC staining images of MMP2 in our brain tissue collection; scale bar = 50 μm. B, Quantification of the MMP2 LI among groups in our tissue collection. The computing method of MMP2 LIs was the same as that of HMGA2 LI and given in mean ± SD. *, P < .05; **, P < .01; ***, P < .001. Linear regression was performed to evaluate the expression correlation between HMGA2 and MMP2 in the tissue collection from 147 gliomas. C,D, Kaplan‐Meier survival curves based on MMP2 protein expression in WHO grade I‐IV glioma (C, n = 147) and grade IV GBM (D, n = 70) samples. E, Kaplan‐Meier survival curves based on MMP2 mRNA expression in GBM patients from the TCGA database. n = 481. F‐G, Kaplan‐Meier analysis based on MMP2 level in all wild‐type IDH1/2 glioma (F, n = 89) and IDH1 R132H mutation‐bearing glioma patients (G, n = 58). The medians of the MMP2 levels were used to stratify the low‐ and high‐expression subgroups in all of the above survival analyses. H, Schematic illustration of the mechanisms by which HMGA2 promotes glioma cell invasion
