
Figure 4.
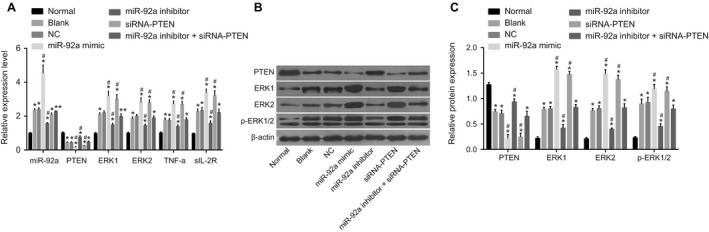
MiR‐92a expression and mRNA and protein expression of PTEN, TNF‐α, sIL‐2R and ERK1/2 in seven groups after transfection. A, miR‐92a expression, mRNA expression of PTEN, TNF‐α, sIL‐2R and ERK1/2; B, Western blotting map; C, protein gray value of PTEN and ERK1/2; miR‐92a, microRNA‐92a; PTEN, phosphatase and tensin homolog deleted on chromosome ten; ERK1/2, extracellular regulated protein kinases 1/2; *, P < 0.05 compared with the normal group; #, P < 0.05 compared with the blank and negative control groups.