
Figure 3.
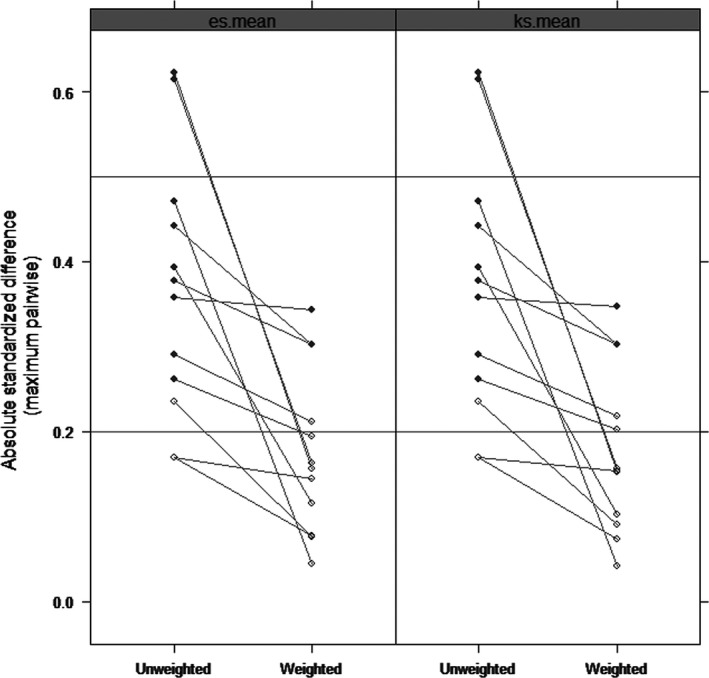
Comparisons of the absolute standardized mean differences (ASMD) by es.mean and ks.mean methods between the age group on the covariates before and after propensity score weighting. The covariates included race, tumor size, node status, PAM50 molecular subtype, risk stratification, DNAm age, and somatic mutations. The statistically significant difference is indicated by the solid circle. The decreases of ASMD after weighting indicates good covariate balance