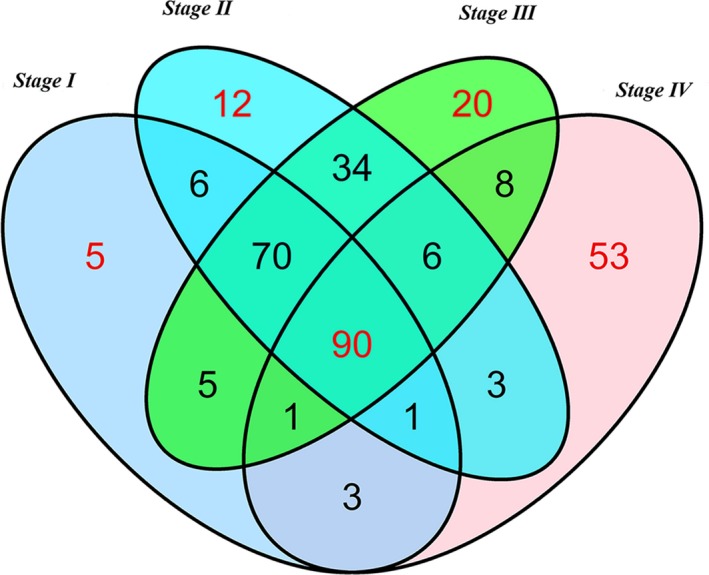
Figure 4.

Venn diagram analysis of differentially expressed lncRNA in Hepatocellular carcinoma. Each ellipse represents a tumor stage group. The RNA in the middle represents significantly and consistently differentially expressed in four groups

Venn diagram analysis of differentially expressed lncRNA in Hepatocellular carcinoma. Each ellipse represents a tumor stage group. The RNA in the middle represents significantly and consistently differentially expressed in four groups