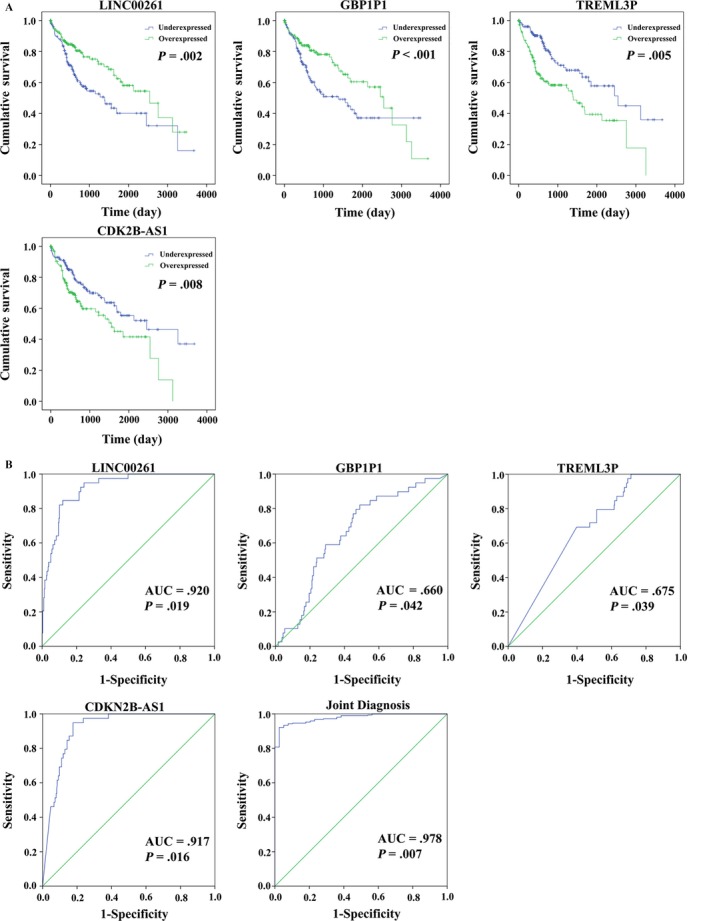
Figure 6.

Four differentially expressed lncRNAs (LINC00261, TRELM3P, GBP1P1, and CDKN2B‐AS1). A, Kaplan‐Meier curves showing the relationship between these four lncRNAs and overall survival. The patients were divided into over‐ and underexpression groups by the mean lncRNAs level; B, ROC curves of the four lncRNAs to distinguish HCC tissue from adjacent normal tissues
