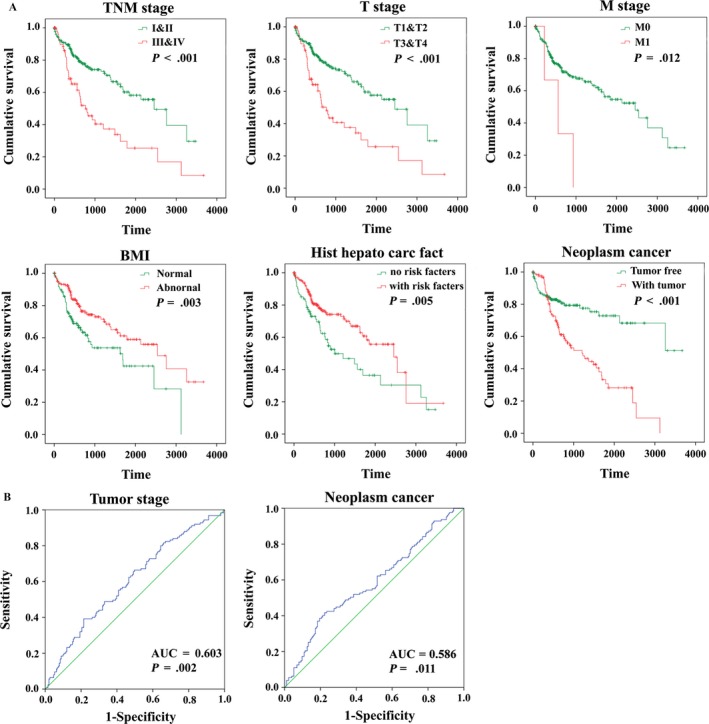
Figure 10.

The prognostic value of different clinical features for OS and the predictive value of the risk score for clinical features of Hepatocellular carcinoma patients. A, Kaplan‐Meier curves of seven independent prognostic indictors. B, ROC curve is predicting different clinical features
