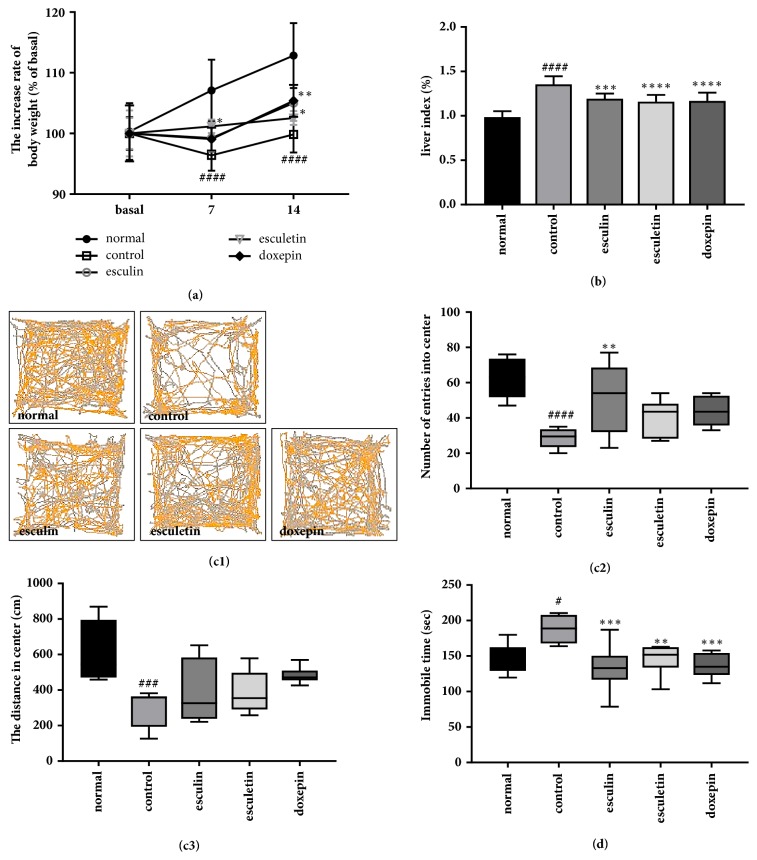
Figure 6.
Effect of different components of FX extract on body and relative liver weight, and depressive-like behavior. (a) The difference in body weight between groups through the experimental procedure (n = 8-9). (b) The difference in relative liver weight between groups (n = 8-10). (c) Representative recordings of total distance travelled in OFT in all groups. Differences between the total distances travelled (n = 7-8) and mean numbers of entries into center (n = 8) in all groups. (d) Mean immobility time between groups in the FST (n = 7-8). Mean ± SD. #P < 0.05, ###P < 0.001, and ####P < 0.0001 versus normal group; ∗P < 0.05, ∗∗P < 0.01, ∗∗∗P < 0.001, and ∗∗∗∗P < 0.0001 versus control group.

