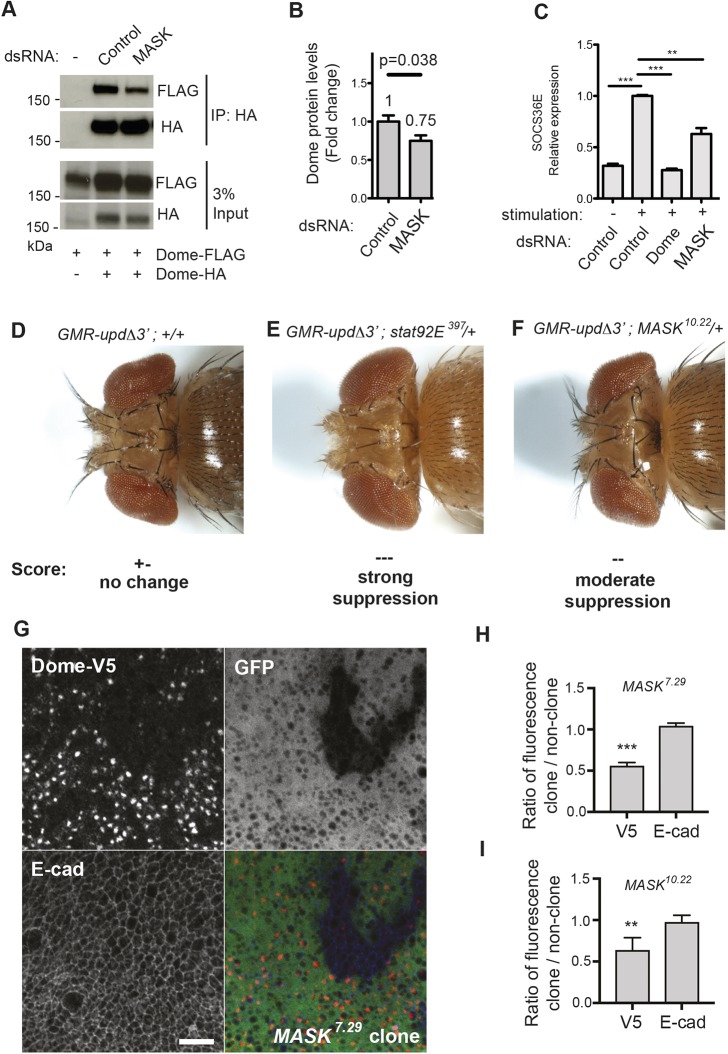
Fig. 2.
MASK regulates pathway activity and receptor levels in vivo. (A) Co-expression of Dome–HA and Dome–FLAG followed by Dome–HA immunoprecipitation (IP) in Drosophila Kc167 cells. Levels of co-precipitated Dome–FLAG are modulated by treatment with the MASK dsRNA. The input is shown in the lower panels. (B) Quantification of the steady-state Dome–FLAG protein levels expressed by Kc167 cells after knockdown of MASK. Results represent the mean±s.d. fold change. P-value is determined by a Student's t-test (n=3). (C) Expression of the JAK/STAT pathway target gene SOCS36E following Upd2 ligand stimulation and treatment with the indicated dsRNAs. Results are the mean±s.d. (n=3). **P<0.01, ***P<0.001 (one-way ANOVA with Dunnett's post-hoc test). (D–F) Dorsal view of eye overgrowth phenotypes caused by ectopic Upd ligand expression driven by GMR-UpdΔ3′. Loss of one copy of STAT92E or MASK suppresses overgrowth. (G) Mitotic clones of MASK7.29 cause a reduction in tubulin-GAL4-driven UAS-Dome-V5 (red) fluorescence, whereas E-cadherin (blue) levels are unaffected. Clones were identified through loss of native GFP (green). Scale bar: 10 μm. (H,I) Quantification of Dome–V5 and E-cad levels in MASK7.29 (H) or MASK10.22 (I) mutant clones. Ratios of fluorescence intensity inside clones and in nearby twin-spots were taken to control for variations across discs. Measurements were averaged (mean±s.d.) over four or more discs with at least two clones per disc. **P<0.01, ***P<0.001 (one-sample t-test with expected mean of 1).

