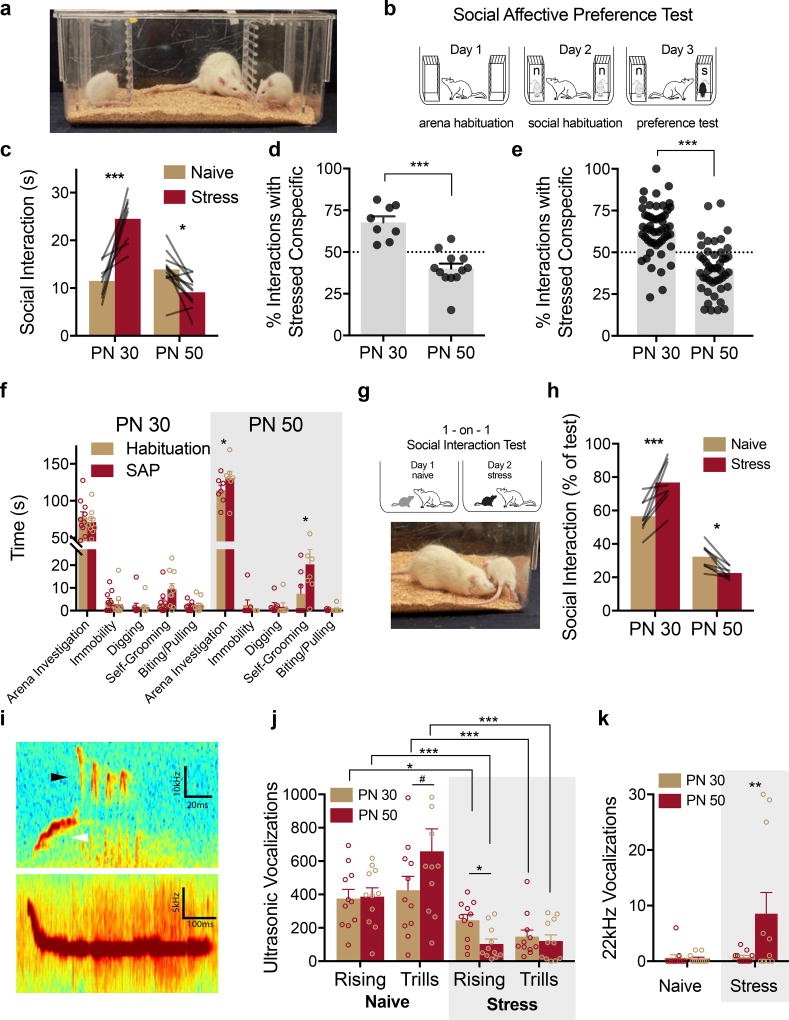
Figure 1. Social affective preference (SAP).
(A) The SAP arena containing juvenile conspecifics on the left and right with an experimental adult in the center. (B) Diagram of SAP test procedure. (C) Mean (individual replicates shown as connecting lines) time spent in social interaction with the naive or stressed conspecific by age (n = 8, PN 30; n = 12, PN 50). A bidirectional effect of age was apparent in time spent interacting with the stressed conspecifics (FAGE(1, 18) = 27.93, p < 0.0001; FAFFECT(1, 18) = 9.965, p = 0.006; FAGE*AFFECT(1, 18) = 46.05, p < 0.0001). Experimental rats spent more time exploring the stressed PN 30 conspecific compared to the PN 30 naive, but spent less time exploring the stressed PN 50 conspecific compared to the PN 50 naive. (D) Mean (+ SEM with individual replicates) data in C expressed as the percent of time spent interacting with the stressed conspecifics relative to the total time spent interacting. Experimental adults showed a marked preference (values greater than 50%) for interaction with stressed conspecifics and avoidance (values less than 50%) of stressed adults (t(18) = 5.783, p < 0.0001, 2-tailed). (E) Mean (+ SEM with individual replicates, n = 51 for PN 30, n = 46 for PN 50) percent preference for interacting with the stressed conspecific pooled from all of the subjects in the experimental control groups included in the current report including vehicle, sham, and light OFF control groups of the later experiments. Percent preference scores for PN 30 and PN 50 interactions were significantly different t(95) = 7.66, p < 0.0001, 2-tailed) from each other, and in both conditions the mean percent preference differed from 50% (PN 30: tone-sample(50) = 6.49, p < 0.0001, 2-tailed; PN 50: tone-sample (45) = 4.39, p < 0.0001, 2-tailed). (F) Mean (+ S.E.M. with individual replicates) time spent in non-social behaviors during habituation tests and SAP tests (n = 10, PN 30; n = 7 PN 50). More investigation of the arena and time spent self-grooming was observed in the PN 50 rats (FAGE*BEHAVIOR*TEST(4, 60) = 3.014, p = 0.025). (G) Diagram of 1-on-1 social interaction test and photo of typical adult-initiated interactions. (H) Mean (individual replicates, ns = 8/ age) time interacting with the naive or stressed conspecific in a 1-on-1 test shown as percent of test time. Experimental adults spent significantly more time interacting with the stressed PN 30 conspecific but significantly less time with the stressed PN 50 conspecific compared to the respective naive conspecific targets (FAGE(1, 14) 103.10, p < 0.0001; FAGE*AFFECT(1, 14) = 31.34, p < 0.0001). (I) Representative audio spectrograms depicting rising (top, white arrow), trills (top, black arrow) and 22kHz ultrasonic vocalizations (USVs). Scale bars indicate Y-axis ranges: 60–70kHz (top) and 30–35kHz (bottom). (J–K) Mean (+SEM with individual replicates, ns = 11/group) number of rising and trill USVs recorded during 5 min one-on-one social interactions. Fewer rising and trill calls were observed during interactions with stressed conspecifics with fewer rising calls observed in stressed adults compared to stressed juveniles but more 22kHz calls observed in stressed adults than stressed juveniles (FSTRESS(1, 40) = 26.16, p < 0.0001; FCALL TYPE(2, 80) = 60.86, p < 0.0001; FSTRESS*CALL TYPE(2, 80) = 20.18, p < 0.0001; FCALL TYPE*AGE(2, 80) = 3.43, p = 0.37). *p < 0.05, ** p < 0.01, *** p < 0.001 (Sidak).

