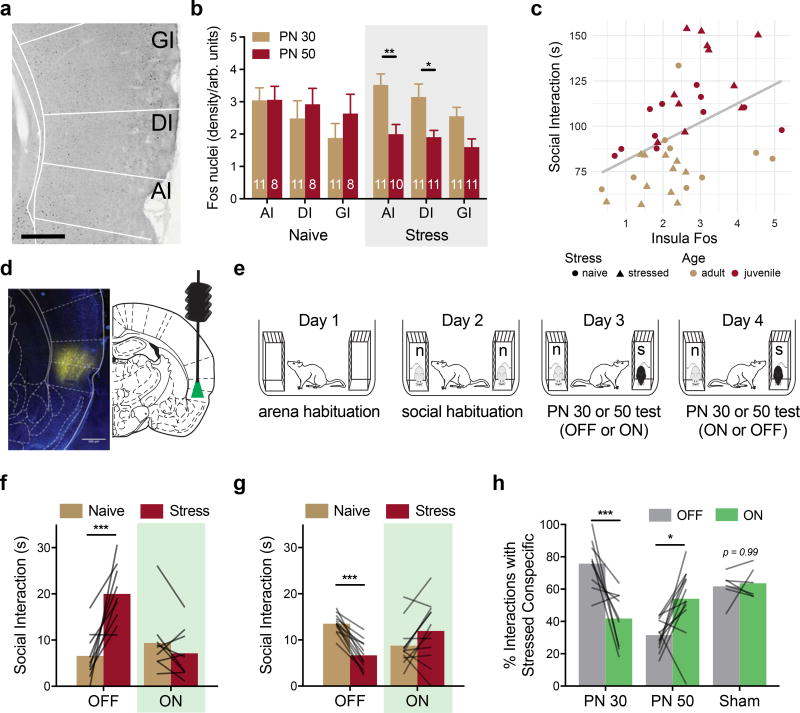
Figure 2. Optogenetic silencing of insular cortex during SAP tests.
(A) Representative digital photomicrograph containing insular cortex regions and Fos immunoreactive nuclei (black ovoid particles). Scale bar = 500µm. (B) Mean (+SEM, numbers indicate number of replicates) Fos immunoreactive nuclei by insular cortex subregion (AI = Agranular, DI = Dysgranular, GI = Granular) quantified 90 min after social interaction with a naive PN 30, naive PN 50, stressed PN 30 or stressed PN 50 conspecific (5 min test). Fos was found in all regions, but there was an effect of stress for interactions with PN 50 rats, such that less Fos was evident after interaction with PN 50 stressed conspecific interactions than after interaction with PN 50 naive conspecifics, and there was less Fos in the AI and DI after interactions with PN 50 Stressed rats than after interactions with PN 30 stressed rats (FSTRESS*AGE(1, 36) = 6.21, p = 0.017; FSUBREGION(2, 72) = 7.90, p = 0.001). (C) Mean Fos immunoreactivity (pooled across insula) predicted time spent in social interaction. Regression analysis indicated strong prediction of social interaction by Fos level, Age, and modest interactions between Stress, Fos and Age (FFOS(1, 34) = 19.72, p < 0.0001, FAGE(1, 34) = 36.93, p < 0.0001; FFOS*STRESS(1, 34) = 3.97, p = 0.055; FSTRESS*AGE(1, 34) = 4.09, p = 0.051). (D) Native mCherry expression in the insular cortex (false colored yellow) from a brain slice adjacent to one containing the cannula tract. (Scale bar = 500µm). (E) Diagram of SAP tests for optogenetic experiments. (F) Mean time spent interacting with PN 30 juvenile conspecifics (n = 9) or (G) PN 50 adult conspecifics (n = 12) on Days 3 and 4 of the SAP test. In the light OFF condition, the experimental adult spent significantly more time interacting with the stressed PN 30 conspecific, but this pattern was abolished in the light ON condition (FAGE*STRESS*LIGHT(1, 19) = 41.31, p < 0.0001). In the light OFF condition, the experimental adult spent significantly less time interacting with the stressed PN 50 conspecific, but this pattern was reversed in the light ON condition. (H) Data from F and G converted to percent preference for interaction with stressed conspecifics. Here, a clear age by light interaction is apparent, with optogenetic silencing of insular cortex eliminating preference for interaction with the stressed juvenile and blocking the pattern of avoidance of stressed adult conspecifics (FAGE*LIGHT(1, 19) = 23.53, p = 0.0001). No effect of optical stimulation was observed in sham transduced rats. * p < 0.05, **p < 0.01, *** p < 0.001 (Sidak). Brain Atlas illustrations were reproduced with permission as previously published in The Brain Atlas in Stereotaxic Coordinates, 4th Edition, Paxinos, G. & Watson, C. Pages 296, 303, 306–317 & 332. Copyright Elsevier (1998).

