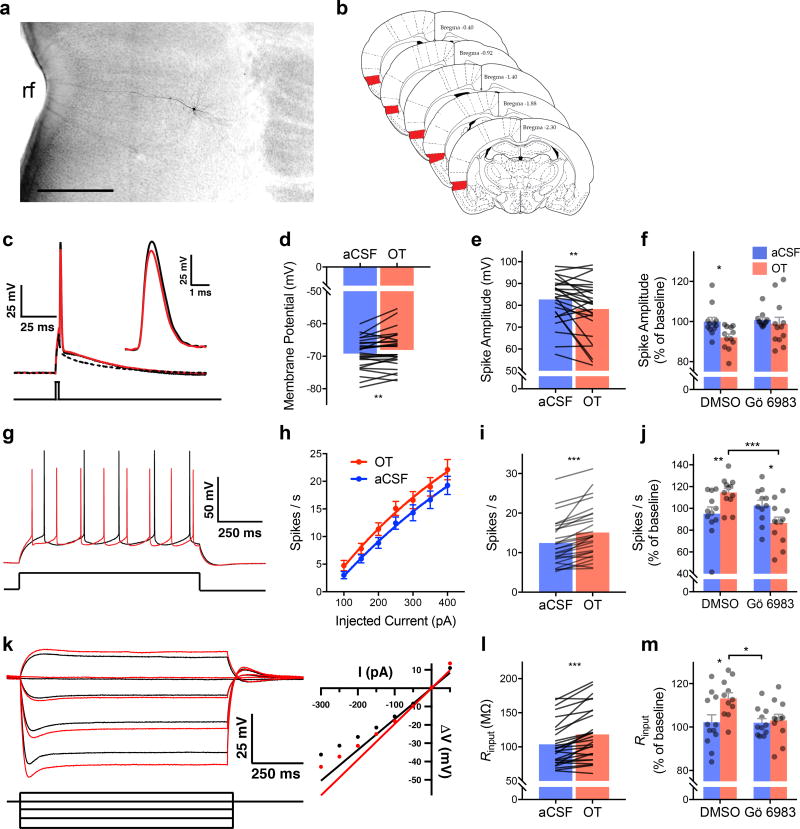
Figure 3. Intrinsic membrane properties in insular cortex pyramidal neurons are modulated by oxytocin and depend upon protein kinase C (PKC).
(A) Digital photomicrograph of a typical biocytin filled neuron, rf = rhinal fissure (Scale bar = 500µm). (B) Schematic diagram illustrating the region of interest for whole cell recordings (red shading). (C) Typical action potential before (black trace) and after bath application of 500nM OT (red). Inset: detail of the AP peak amplitude difference. Intrinsic properties were characterized from a sample of 27 neurons; the dependence of OT effects on PKC was determined by first characterizing the change in intrinsic properties from baseline followed by no treatment (aCSF) or OT (500nM) in either the presence of DMSO or DMSO and the pan-PKC inhibitor Gö 6983 (200nM, aCSF-DMSO n = 12; OT-DMSO; n = 12, aCSF-Gö; n = 11; OT-Gö, n = 12). (D) Mean action potential amplitude; OT significantly reduced amplitude. (E) Mean resting membrane potential. OT significantly depolarized the membrane at rest. (F) Mean action potential amplitude (+S.E.M. with individual replicates); OT significantly reduced spike amplitude but did not change in the presence of Gö 6983 (FOT(1, 21) = 4.56, p = 0.044, aCSF vs. OT, p = 0.040). (G) Typical train of spikes evoked by 1 s 150pA current injection before (black) and after (red) OT. (H) Mean (+/− SEM) spikes evoked by increasing current injections; OT increased the spike frequency (FOT(1, 279) = 10.42, p = 0.001). (I) Mean action potentials evoked by 250pA current; significantly more spikes were evoked after OT. (J) Mean (+ S.E.M. and individual replicates) spike frequency upon 250pA depolarization; OT increased spiking compared to aCSF and Gö 6983 reduced spiking on its own (FOT*Go(1, 43) = 11.77, p = 0.0013, aCSF-OT vs. Gö-OT, p = 0.0007). (K) Membrane potentials evoked by subthreshold and hyperpolarizing current injections (left) and typical rectification curve (right) before (black traces) and after (red traces) OT. (L) Mean input resistance (Rinput); OT significantly increased Rinput. (M) Mean (+ S.E.M. and individual replicates) input resistance. OT increased input resistance (FGo(2, 20) = 4.66, p = 0.043, OT-DMSO vs. OT-Gö, p = 0.03). Symbols and connecting lines indicate individual replicates. *p < 0.05, ** p < 0.01, *** p < 0.001 (Sidak). Brain Atlas illustrations were reproduced with permission as previously published in The Brain Atlas in Stereotaxic Coordinates, 4th Edition, Paxinos, G. & Watson, C. Pages 296, 303, 306–317 & 332. Copyright Elsevier (1998).

