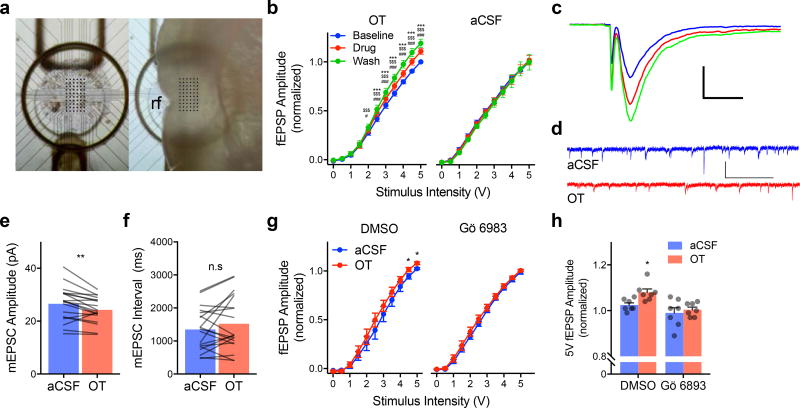
Figure 4. Oxytocin modulates excitatory synaptic transmission in the insular cortex.
(A) Top view of 60 channel perforated MEA (left) for acute extracellular recordings of the insular cortex. Right depicts location of insular cortex slice during recording, rf = rhinal fissure. (B) Input/output curves for fEPSPs (Mean +/− SEM, OT n = 10, aCSF n = 9 slices) normalized to the peak amplitude observed in response to 5V stimulation under baseline conditions. OT significantly increased EPSP amplitude beginning at 2V with further enhancement during the washout (FSTIMULUS(10, 90) = 598.20, p < 0.0001; FDRUG(2, 18) = 11.99, p < 0.001; FSTIMULUS*DRUG(20, 180) = 11.34, p < 0.0001). Without application of OT, EPSPs remain stable across the duration of the experiment (aCSF: FSTIMULUS(10, 80) = 385.90, p < 0.0001). ### p < 0.0001 OT vs. Baseline, $$$ p < 0.0001 Wash vs. Baseline, *** p < 0.0001 Wash vs. OT (Sidak). (C) Typical fEPSPs evoked by biphasic extracellular stimulation at baseline (blue) during application of 500nM OT (red) and after washout (green). Scale bar 500µV/ms. (D) Representative voltage clamp recordings of mEPSCs recorded before (aCSF; blue) and after OT (red). (E) Mean mEPSC amplitude before and after OT (n = 19 neurons); OT significantly reduced amplitude, **(paired t(18) = 3.29, p = 0.004, 2-tailed). (F) Mean mEPSC interval (n = 19 neurons); no effect of OT was apparent, (paired t(18) = 1.42, p = 0.17, 2-tailed). (G) Input/output curve for fEPSPs (Mean +/− S.E.M., n = 7 slices/condition) normalized to the peak amplitude observed in response to 5V stimulation under baseline conditions. OT (1µM) increased fEPSP at 4.5 and 5mV while no effect was observed in the presence of Gö 6983. *FSTIMULUS*DRUG(10, 240) = 3.40, p < 0.0003, OT vs. aCSF at 4.5 and 5V, p = 0.0306 and p = 0.0181, respectively (Sidak). (H) Mean (+ S.E.M. and individual replicates) fEPSP amplitude from (G) at 5V (FOT(1, 24) = 5.076, p = 0.034). *OT-DMSO vs. aCSF-DMSO p = 0.018; vs. aCSF-Gö, p = 0.002; vs. OT-Gö, p < 0.0004 (Fisher’s LSD).

