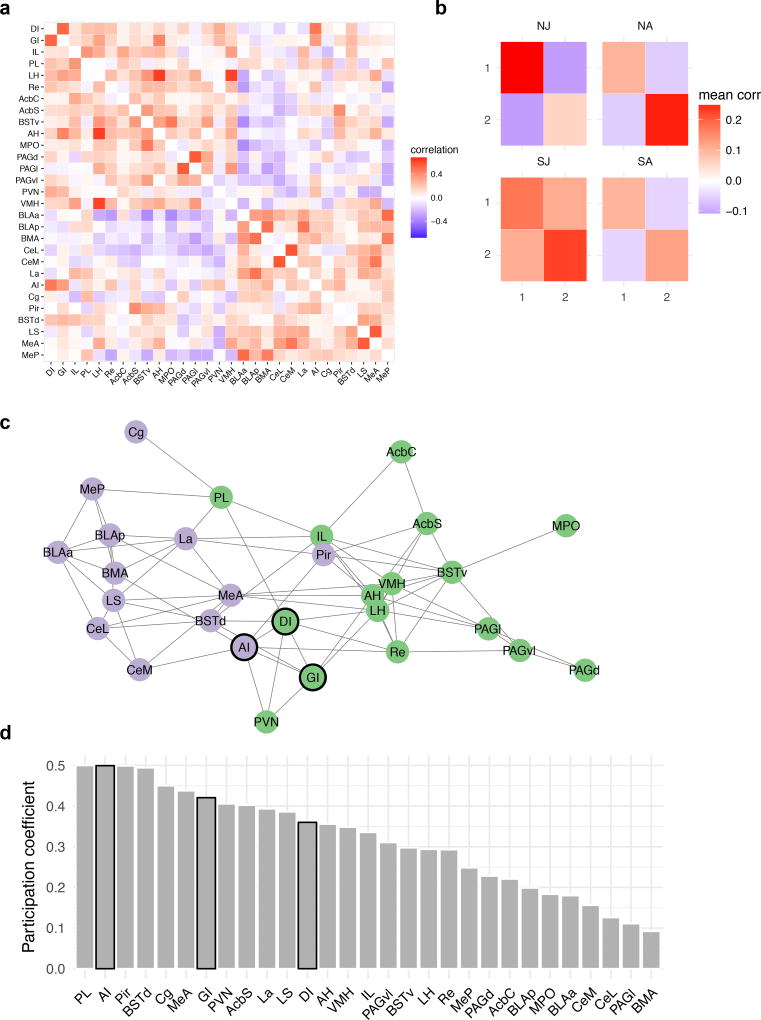
Figure 6. Insular Cortex and the Social Decision-Making Network.
Fos immunoreactivity was determined in 29 ROIs of the rats (N=44) used in the USV quantification experiment (abbreviations provided in Sup. Table 1 and representative images in Sup. Fig. 7). (A) Correlation matrix indicating functional correlations (Kendall’s tau) among ROIs. (B) Graph theory based community detection analyses identified two modules. Functional correlations within and between modules 1 and 2 were averaged across ROIs and shown for each group. (C) Network visualization of the nodes in modules 1 (green) and 2 (purple). Here an arbitrary threshold of 0.2 was applied to facilitate network visualization, such that only edges exceeding the threshold are shown, but note that all network analyses were based on the unthresholded network. Insular cortex nodes are outlined in black. (D) The degree to which each node is connected to multiple functional modules was estimated by computing the participation coefficient. Bars corresponding to insular cortex ROIs are outlined in black. Network analyses by treatment group provided in Sup. Fig. 8. NJ = naive juvenile, NA = naive adult, SJ = stressed juvenile, SA = stressed adult.

