Figure 2.

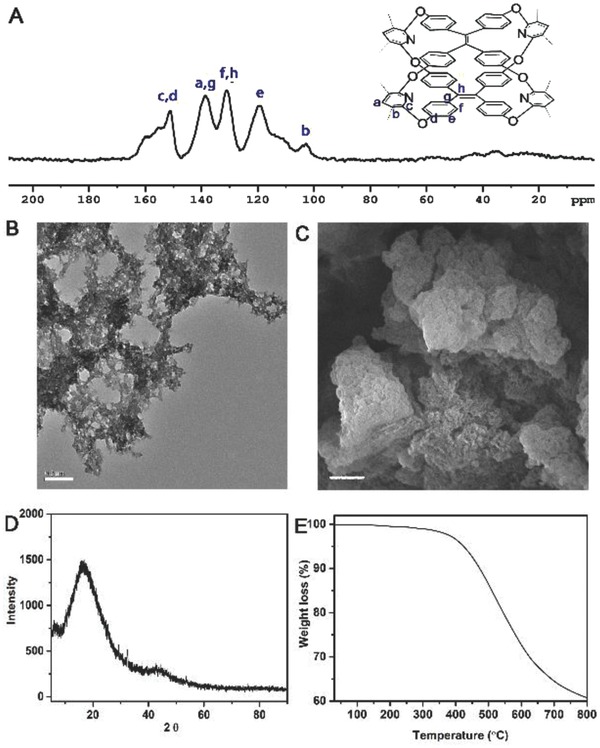
The 13C CP‐MAS NMR spectroscopy A), TEM image B) (bar = 0.2 µm), SEM image C) (bar = 2 µm), powder X‐ray diffraction D), and the TGA E) of pTOC.

The 13C CP‐MAS NMR spectroscopy A), TEM image B) (bar = 0.2 µm), SEM image C) (bar = 2 µm), powder X‐ray diffraction D), and the TGA E) of pTOC.