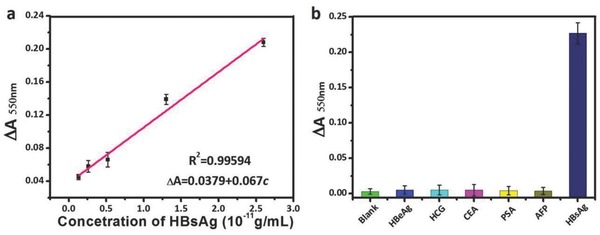
Figure 7.

Calibration curve establishment and detection specificity evaluation. a) Calibration curve of HBsAg using SiO2 NPs‐amplified Scadge‐Diag. b) Specificity tests: ΔA at 550 nm measured from various interfering biomarkers including 25 ng mL−1 HBeAg, 52 U mL−1 HCG, 72 ng mL−1 CEA, 50 ng mL−1 PSA, 10 ng mL−1 AFP, and 5 ng mL−1 HBsAg. Error bars show the standard deviations of three independent measurements.
