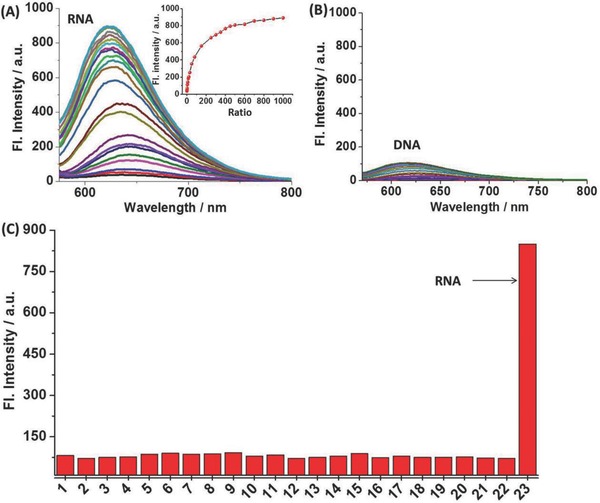
Figure 2.

A) Fluorescence titration experiment of TP‐MIVC (10 × 10−6 m) in PBS buffer solution with the addition of RNA. Inset: Fluorescence variation trend with increasing of RNA. B) Fluorescence titration experiment of TP‐MIVC (10 × 10−6 m) in pure buffer solution with increasing DNA. C) Fluorescence responses of TP‐MIVC (10 × 10−6 m) to biological analytes in buffer solution. The concentrations of various biological analytes: amino acids, 1 × 10⁻³ m; GSH, 1 × 10⁻³ m; cations and anions, 2 × 10⁻³ m; and reactive oxygen and nitrogen species, 0.3 × 10⁻³ m. Legend: 1, TP‐MIVC; 2, Hcy; 3, GSH; 4, Ac−; 5, Br−; 6, Cl−; 7, CN−; 8, HPO4 −; 9, HSO3 −; 10; I−; 11, Mg2+; 12, PO4 3−; 13, SO3 2−; 14, SO4 2−; 15, NO2 −; 16, NO3 −; 17, H2O2; 18, BSA; 19, anti‐EGFR; 20, glucose; 21, LPS; 22, tubulin; 23, RNA. λex: 488 nm.
