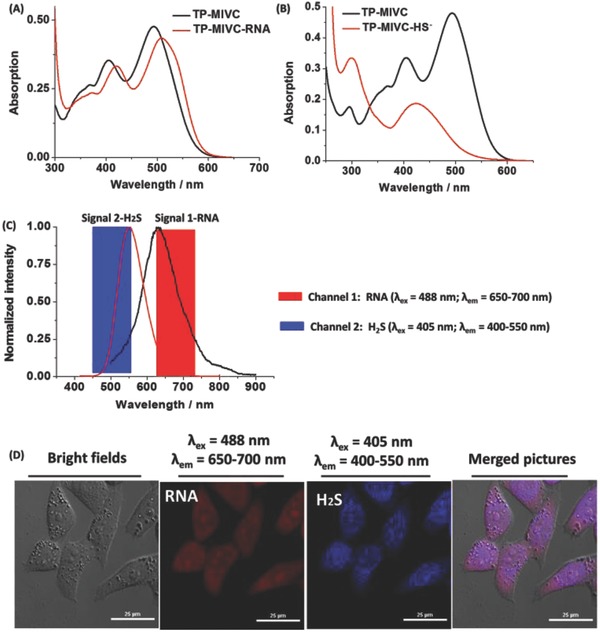
Figure 4.

A) Absorption spectra of TP‐MIVC (10 × 10−6 m) in the absence and presence of HS−. B) Absorption spectra of TP‐MIVC (10 × 10−6 m) in the absence or presence of RNA. C) Fluorescence spectra of TP‐MIVC under 405 nm excitation in the presence of HS−, and fluorescence spectra of TP‐MIVC under 488 nm excitation in the presence of RNA. D) Confocal images of HeLa cells treated with TP‐MIVC (10 × 10−6 m) for 30 min. From left to right: Bright‐field image; the red emission channel (λex = 488 nm, λem = 650–700 nm); the blue emission channel (λex = 405 nm, λem = 400–550 nm); and merged image of (A) and (C). Scale bar = 25 µm.
