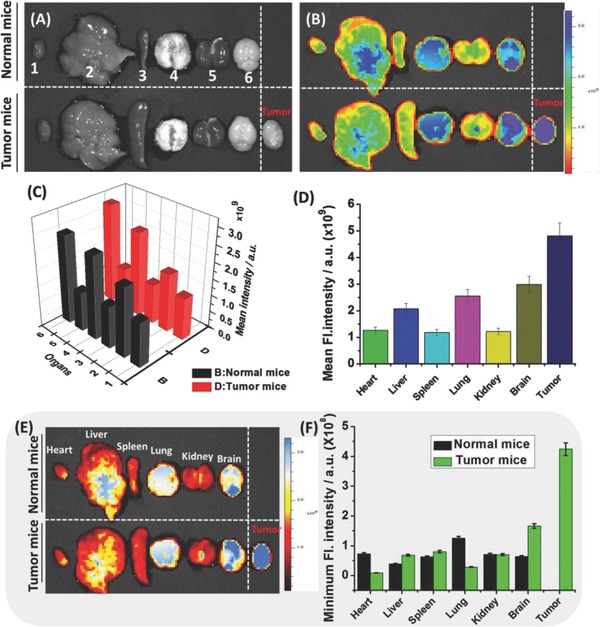
Figure 8.

Fluorescence imaging of endogenous RNA with the probe TP‐MIVC in different mouse organs by an in vivo imaging system. A) Bright field images of mouse organs treated with 200 × 10−6 m probe, 1–6: heart, liver, spleen, lung, kidney, brain, and tumor tissuess incubated with 200 × 10−6 m TP‐MIVC, respectively. B) Images of fluorescence and bright fields of mice organs treated with 200 × 10−6 m probe. λex = 520 nm, λem = 620 nm. C) Mean fluorescence intensities in various organs of normal and tumor mice. D) Mean fluorescence intensities in various organs of tumor mice. Error bars represent standard deviation (±S.D.), n = 3. E) Images of fluorescence and bright fields of mice organs treated with 200 × 10−6 m probe. λex = 520 nm, λem = 620 nm. F) Minimum fluorescence intensities in various organs of normal and tumor mice. Error bars represent standard deviation (±S.D.), n = 3. λex = 520 nm, λem = 620 nm.
