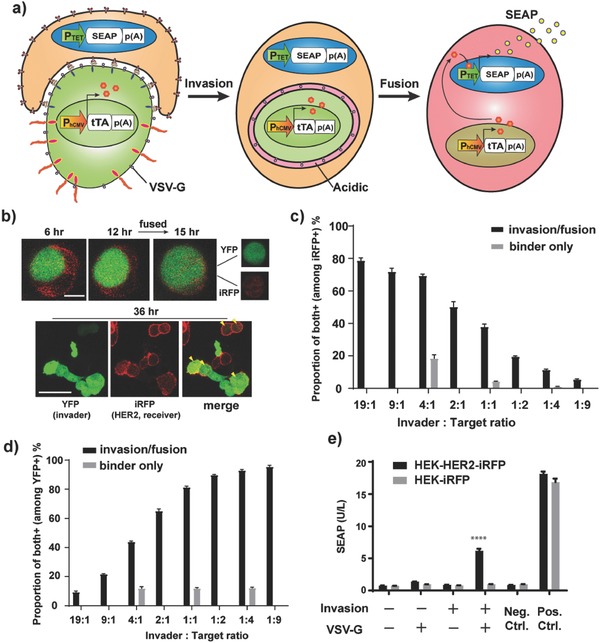
Figure 2.

Target‐cell‐specific cell invasion/fusion system. a) Schematic illustration. Invader cells are equipped with the cell invasion components plus VSV‐G, which promotes cell fusion under acidic conditions. Since receiver cells attempt to degrade invader cells by lysosomal digestion, the environment of invader cells becomes acidic after invasion. This promotes fusion of the invaded cells with receiver cells, and the whole intracellular contents of invader cells are released into cytosol of receiver cells. For semiquantitative assay using SEAP reporter, invader cells were transfected with constitutive tTA expression vector, and receiver cells were transfected with tTA‐responsive SEAP expression vector. Upon cell fusion, SEAP expression from the tTA‐responsive promoter is triggered by supply of tTA from the invader cells. With this system, we could evaluate invasion without the need for subjective assessment of cell‐in‐cell structure. b) Images showing cell fusion after invasion. Invader cells were transfected with pEYFP‐C1, pMD2.G (PhCMV‐VSV‐G‐pA) together with invasion components (pRK47 and pRK48). The cells were mixed with HEK‐HER2‐iRFP cells and imaging was conducted under a confocal fluorescence microscope. Time above the images indicates time after the start of imaging (imaging was started at 3 h after cell mixing). Yellow arrowheads in “merge” indicate fused cells bearing both YFP and iRFP fluorescence. The scale bar in the upper image indicates 10 µm, and that in lower image indicates 50 µm. c,d) Assessment of the effect of invader: target ratio on invasion/fusion efficacy. The same invader cells as in (b) (for binder‐only cells, only pRK47 and pEYFP‐C1 were transfected) (presorted by FACS using YFP fluorescence) were mixed with HEK‐HER2‐iRFP in various ratios (19:1–1:9. For the binder‐only control, only ratios of 4:1, 1:1, and 1:4 were tested). The cells were seeded in 96 well plates (5 × 10⁵ cells mL−1 in total). At 24 h later, the cells were analyzed by FACS. See Figure S5 (Supporting Information) for details of the analysis. c) Proportion of iRFP+/YFP+ cells among iRFP+ cells (reflecting the proportion of receiver cells that were indeed invaded/fused with invader cells). d) Proportion of iRFP+/YFP+ cells among YFP+ cells (reflecting the proportion of invader cells that indeed invaded/fused with target cells). e) Semiquantitative invasion/fusion assay. The receiver cells (HEK‐HER2‐iRFP or HEK‐iRFP) were transfected with pMX9 (PTET‐SEAP‐pA), and the invader cells were transfected with pDB24 (PhCMV‐tTA‐pA) as well as invasion components (pRK47 and pRK48) and VSV‐G (pMD2.G) (omitted components were replaced with pcDNA3.1(+)). Invader cells were mixed with receiver cells, and SEAP expression was assayed at 24 h after cell mixing. Error bars of all the figures represent SEM (n = 3) of three independent experiments. ****p < 0.0001 (against all the other conditions except positive controls), two‐tailed Student's t‐test.
