Figure 3.

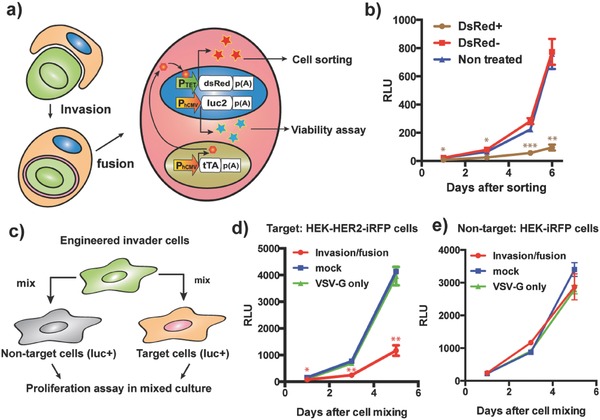
Invasion/fusion system for target‐cell‐specific cell ablation. a) Schematic illustration of the assay for proliferation of fused cells. Receiver HEK‐HER2‐iRFP‐Luc‐ZsGreen cells were transfected with pTREtight‐dsRed (PTET‐dsRed‐pA), and invader cells were transfected with pRK47, pRK48, pMD2.G, and pDB24 (PhCMV‐tTA‐pA). After cell fusion, tTA drives expression of DsRed, which allows sorting of the fused DsRed+ cells. The dsRed+ cells (as well as equal numbers of dsRed‐ cells and nontreated HEK‐HER2‐iRFP‐Luc‐ZsGreen cells) were seeded on a 96 well plate, and proliferation was traced by firefly luminescence assay. b) Result of the luminescence assay. Some luminescence increase occurred in the dsRed+ population due to contamination with nonfused cells, since we could not completely exclude cell doublets during FACS to capture large fused cells. c) Proliferation assay in the mixed culture condition. Engineered invader cells were mixed with HEK‐HER2‐iRFP‐Luc‐ZsGreen or HEK‐iRFP‐Luc‐ZsGreen cells (invader/receiver = 11/1), and proliferation of receiver cells was traced with firefly luciferase assay. d) Proliferation of HEK‐HER2‐iRFP‐Luc‐ZsGreen cells with invader cells having different components (invasion/fusion: pRK47, pRK48, and pMD2.G). Mock: pcDNA3.1(+), VSV‐G only: pMD2.G. pcDNA3.1(+) was used to replace omitted components. The same number of receiver cells was seeded at Day 0. e) Proliferation of HEK‐iRFP‐Luc‐ZsGreen cells with the same invader cells as in (d). Error bars in all graphs represent SEM (n = 3) of three independent experiments. *p < 0.05, **p < 0.01, ***p < 0.001. b) DsRed+ condition was compared to both DsRed‐ and nontreated conditions. d,e) Invasion/fusion condition was compared to both mock and VSV‐G only conditions.
