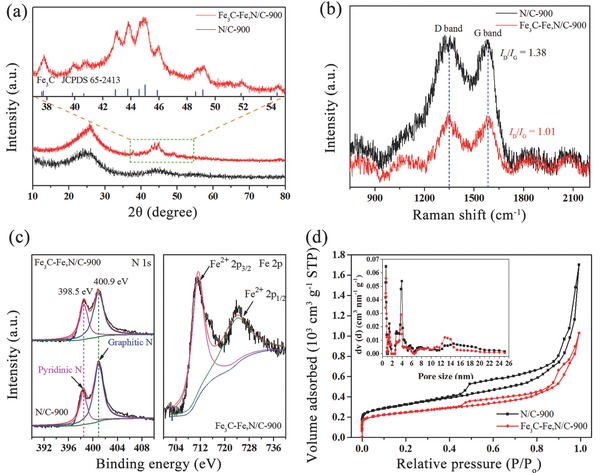
Figure 2.

a) XRD patterns and corresponding selected spectra recorded at a scan rate of 0.1° min−1, b) Raman spectra, c) high‐resolution N 1s and Fe 2p XPS spectra, and d) N2 adsorption–desorption isotherms of Fe3C‐Fe,N/C‐900 and N/C‐900.

a) XRD patterns and corresponding selected spectra recorded at a scan rate of 0.1° min−1, b) Raman spectra, c) high‐resolution N 1s and Fe 2p XPS spectra, and d) N2 adsorption–desorption isotherms of Fe3C‐Fe,N/C‐900 and N/C‐900.