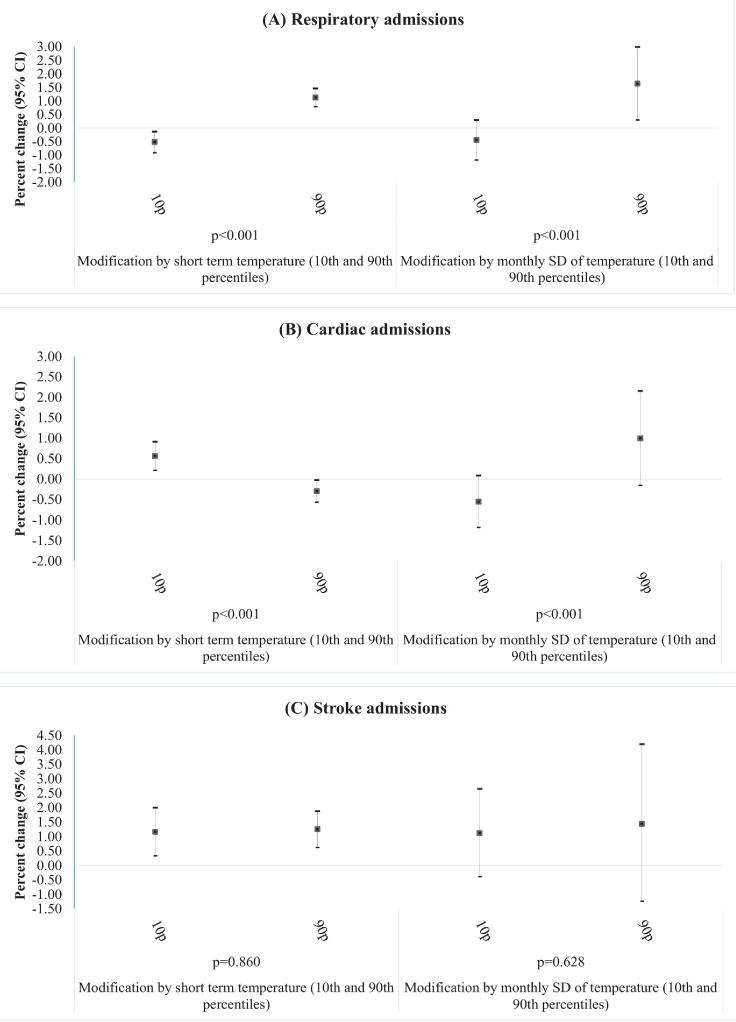
Figure 2. The effect of short-term PM2.5 across the range of short-term temperature and monthly standard deviation (SD) of temperature.

Results are presented as percent change and 95% Confidence Intervals (CI) for an IQR increase in short-term exposure to PM2.5 at the 10th and 90th percentiles of the distribution of short-term exposure to temperature and monthly standard deviation of temperature.
