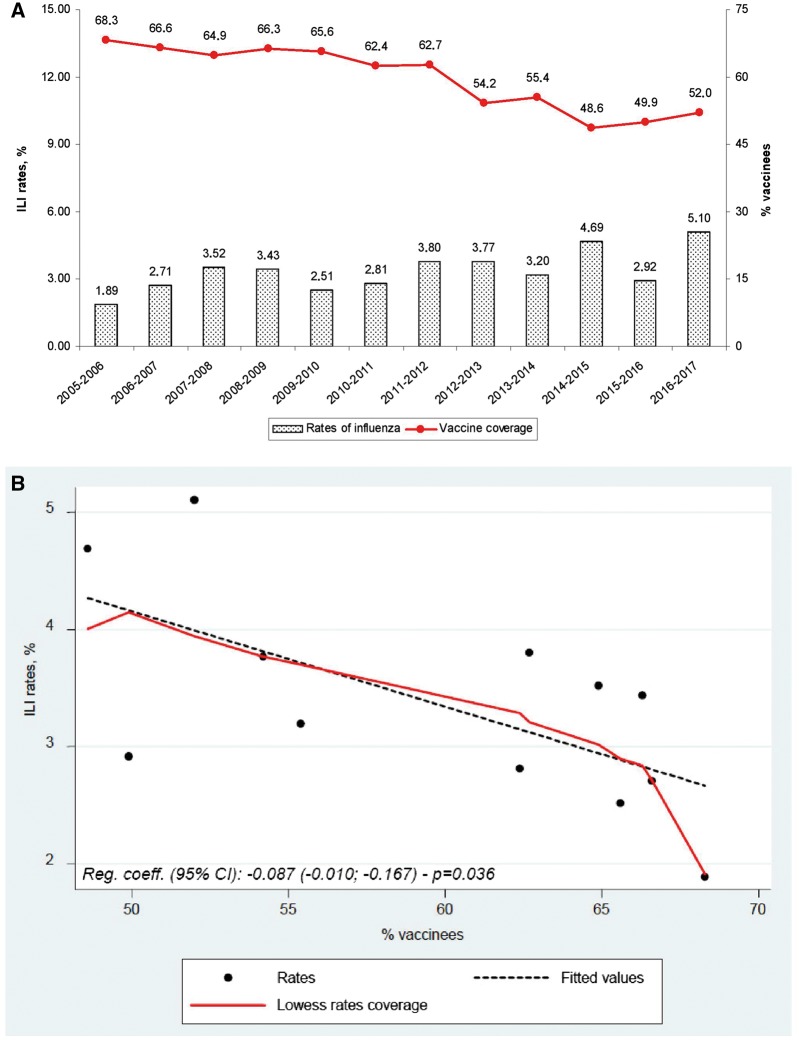
Figure 1.
(A) Rates of influenza and percentage of vaccine coverage among Italian elderly during influenza seasons 2005–17 (sources: Italian National Institute of Health and Ministry of Health) (B) Scatter-plot (and regression lines) of the overall influenza rates among Italian elderly during influenza seasons 2005–17 vs. the percentage of elderly that were vaccinated for influenza

