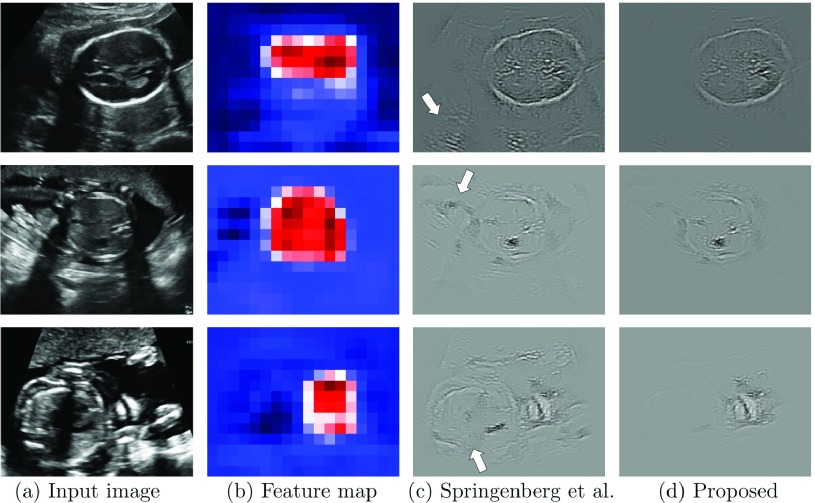
Fig. 3.
Examples of saliency maps. Column (a) shows three different input frames, (b) shows the corresponding class score maps  obtained in the forward pass of the network, (c) shows saliency maps obtained using the method by Springenberg et al.
[32] and (d) shows the saliency maps resulting from our proposed method. Some of the unwanted saliency artefacts are highlighted with arrows in (c).

