
Fig. 3.
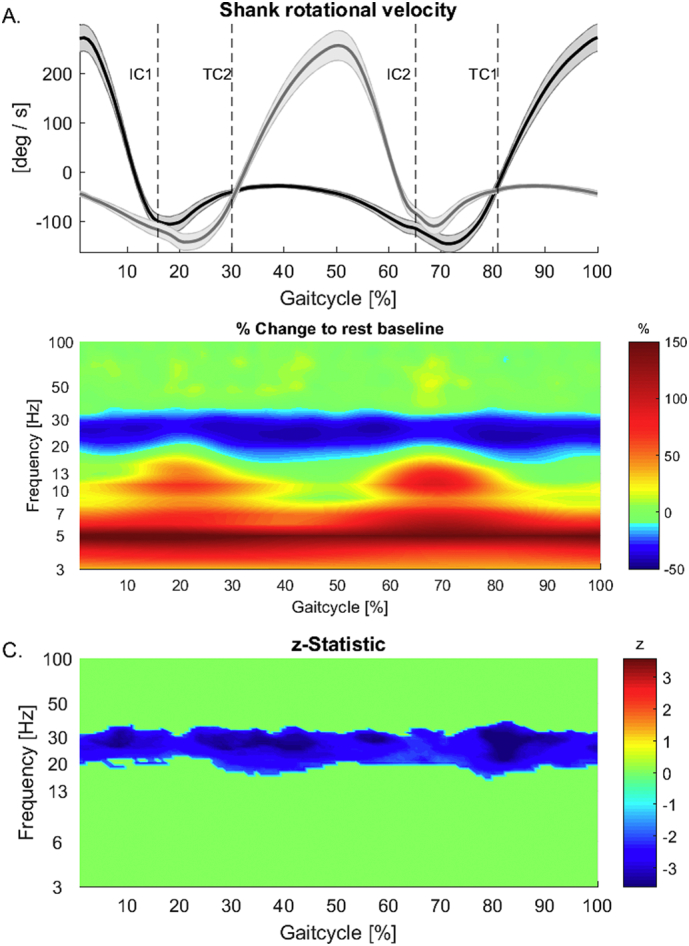
A. Group shank rotation velocity. Gait cycle is epoched between the peak of the shank rotational velocity of one leg and the following peak of the same leg. Average contains epochs starting with left (e.g. Supplementary Fig. 3E) and right legs (e.g. Supplementary Fig. 3F). B, C. Time-frequency group analysis showing gait cycle locked modulation in relation to average resting using “contralateral averaging”. While high beta frequency power is attenuated across the gait cycle, low frequencies show increases. Frequencies between 8 and 20 Hz do show increases in power in the double support periods of the gait-cycle. C. Group z-statistics for comparison between gait and rest showing significant decreases in power during gait in the high beta range (20–30 Hz) across the whole gait-cycle. Non significant z-values are zeroed out.