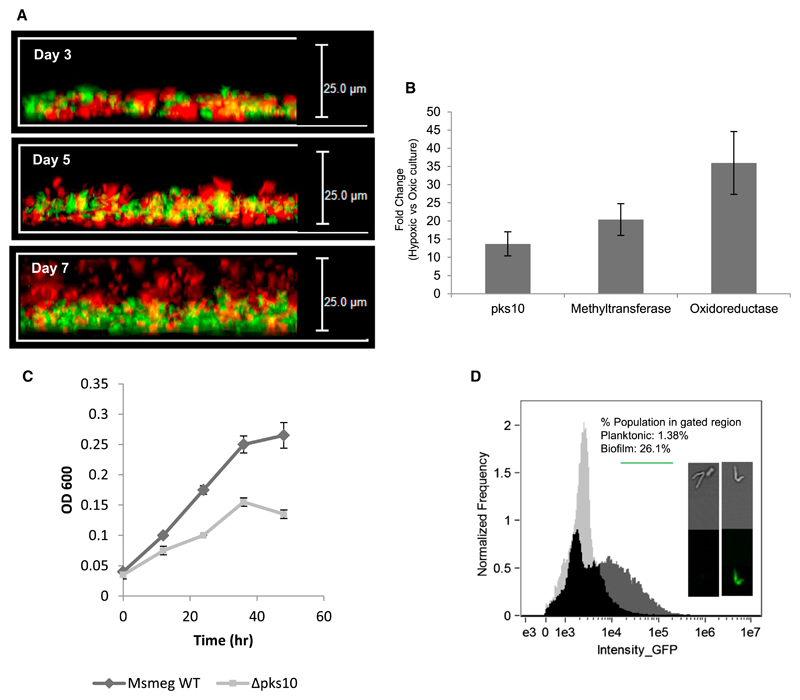
Figure 6. Hypoxia and the type III pks Gene Cluster.
(A) Localization of Msmeg WT (green) and Msmeg Δpks10 (red) strains along the vertical layers of biofilm.
(B) qRT-PCR expression analysis of the type III pks gene cluster under hypoxic conditions.
(C) Planktonic growth curve of the Msmeg WT and Δpks10 strains under hypoxic conditions.
(D) pks10 promoter activity under planktonic and biofilm conditions. The frequency versus intensity plots for the two cultures were overlapped to show the exclusive GFP-positive population of the biofilm (dark gray).

