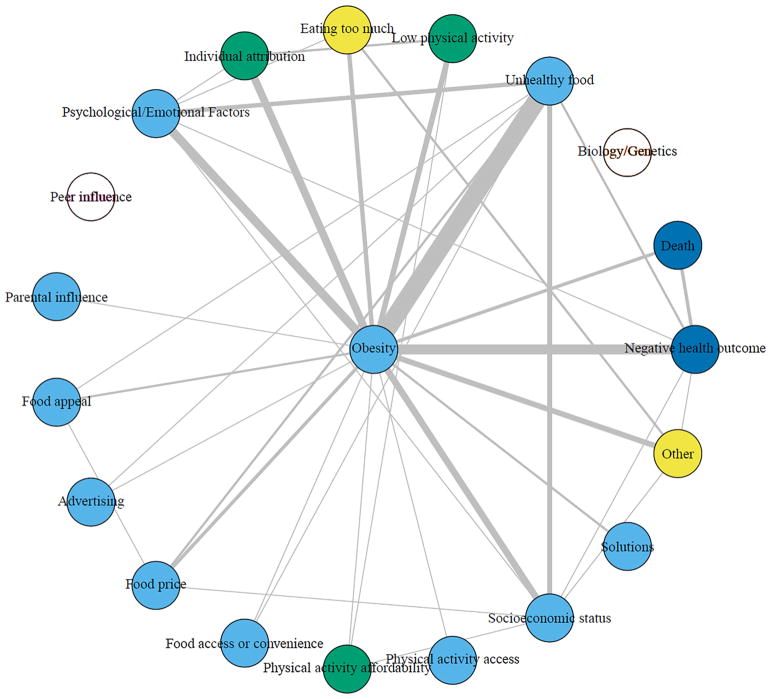
Fig. 4.
Visualization of youths’ aggregated mind maps after final systems thinking session. This figure provides the visualization of the youths’ aggregated mind maps after the final systems thinking workshop session. Each node is a concept subtheme with obesity provided in the center. The concept colors represent cohesive subsets identified by partitioning algorithm. White indicates the concept was not written on any of the participants’ mind maps. Line thickness represents the number of participants who connected the pair of concepts.

