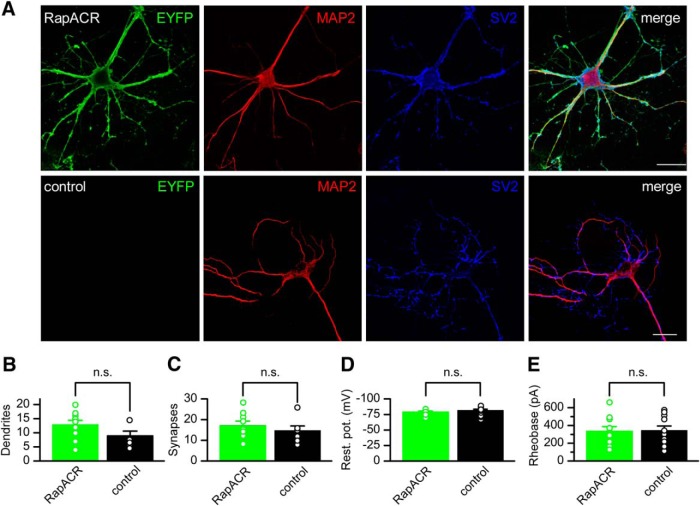
Figure 2.
RapACR expression does not change morphologic and physiologic parameters of neurons. A, Immunofluorescent images of neurons transduced with RapACR_EYFP fusion (top row) or control (non-transduced) neurons (bottom row) and stained with antibodies against EYFP (green channel), MAP2 (microtubule associated protein 2) as the dendrite marker (red channel), and SV2 (synaptic vesicle protein 2) as the synapse marker (blue channel). Scale bar, 20 µm. B, C, The number of dendrites per neuron and synapses per dendritic length of 20 µm, respectively. The data points are mean ± SEM (n = 10 and n = 7 cells for RapACR and control, respectively). D, E, The resting potential (abbreviated as rest. pot. on the y-axis in panel D) and rheobase in the dark. The data points are mean ± SEM (n = 9 and n = 13 cells for RapACR and control, respectively, tested 8–14 d after transduction). Statistical significance was tested by the Mann–Whitney test.

