Figure 4.
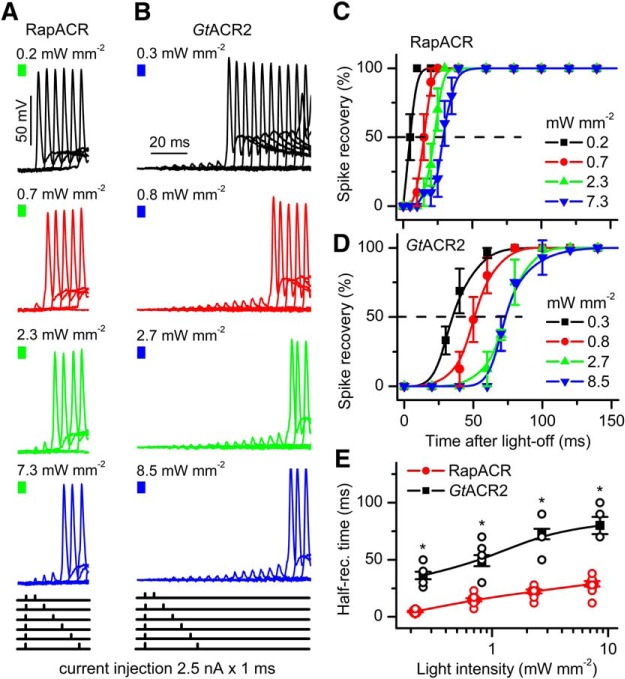
Using RapACR improves temporal resolution of neuronal silencing. A, B, Representative series of overlaid voltage traces recorded from neurons expressing RapACR or GtACR2, respectively, illuminated for 500 ms (the end of the light pulse is shown as a colored bar on top) at 520 or 470 nm, respectively, and stimulated with injection of a pair of 1-ms current pulses, the first of which was applied at the end of illumination, and the second of which, at an incrementally increased time after switching off the light (the injection protocols are schematically drawn at bottom; for GtACR2, only the first six protocols are shown). Passive response of the membrane (recorded under complete inhibition of spiking with light) was digitally subtracted. C, D, The time course of recovery of spiking after illumination measured as shown in panels A, B for cells that could be inhibited with 1% light intensity. The data points are the mean values ± SEM (n = 10 and n = 8 neurons for RapACR and GtACR2, respectively). E, The dependence of the time of 50% recovery of spiking on the light intensity calculated from the same cells as in C, D; *p < 0.001 (pairwise comparison of RapACR and GtACR2 data at each intensity by the Mann–Whitney test). Data obtained in each individual neuron are shown as empty circles.

