Figure 5.
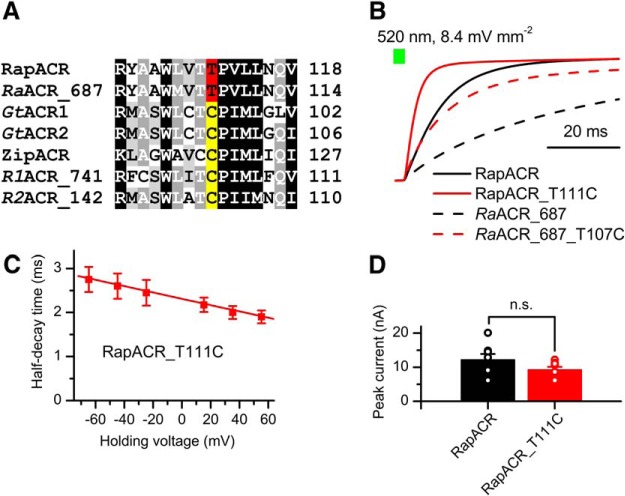
Characterization of the fast RapACR_T111C and RaACR_687_T107C mutants. A, A ClustalW alignment of the 3d transmembrane helix around the Cys-128 position (CrChR2 numbering) from indicated ACRs. The Thr residues found in this position are highlighted red, Cys residues, yellow. B, Normalized photocurrent decay after 1-s illumination recorded from wild-type RapACR (black, solid) and RaACR_687 (black, dashed), and the corresponding T111C (red, solid) and T107C (red, dashed) mutants. C, The dependence of the half-decay time of RapACR_T111C photocurrent on the holding voltage corrected for the liquid junction potential. The data points are the mean ± SEM (n = 4 cells). D, Peak photocurrent amplitude at -60 mV. The wild-type data are from Figure 1A, the data for RapACR_T111C are the mean values ± SEM (n = 8 cells). Statistical significance was tested by the Mann–Whitney test. The values obtained in individual cells are shown as open circles.

