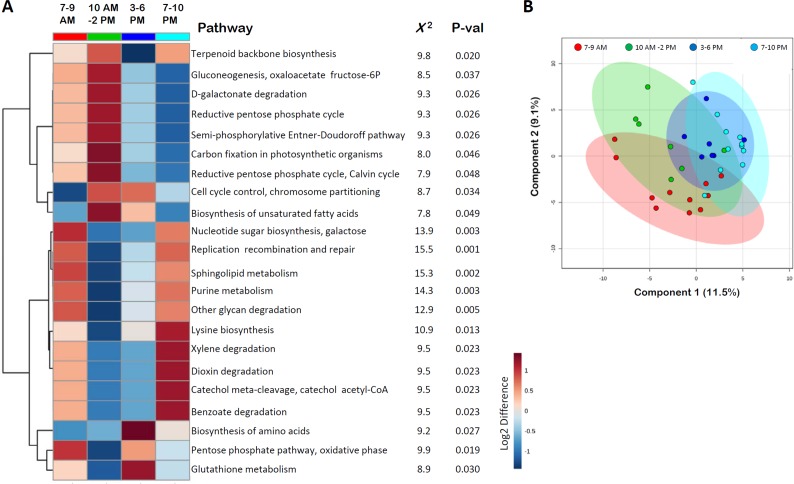
Fig 5. Changes in functional microbiome expression across time.
(A) The hierarchical heat map displays average abundance values for microbial RNAs representing 22 KEGG/COG metabolic pathways, that displayed nominal differences (p<0.05) in expression across 4 time periods (7–9 AM, 10 AM-2 PM, 3–6 PM, 7–10 PM). The dendrogram (y-axis) represents inter-relatedness of KEGG/COG pathway activity measured by Pearson distance metric across the 120 samples. Red denotes relative increased abundance of KEGG/COG transcripts, while blue denotes relative decrease in related transcripts. Chi-square and raw p-values (Kruskal-Wallis ANOVA) are displayed for each of the 22 pathways. (B) A partial least squares discriminant analysis utilizing mean abundance levels for all 202 KEGG/COG metabolic pathways with microbial RNA mappings is displayed for the four collection time periods. Note that global metabolic activity in these 202 pathways achieves partial separation of the four time periods, while accounting for 20.6% of the variance in the dataset.

