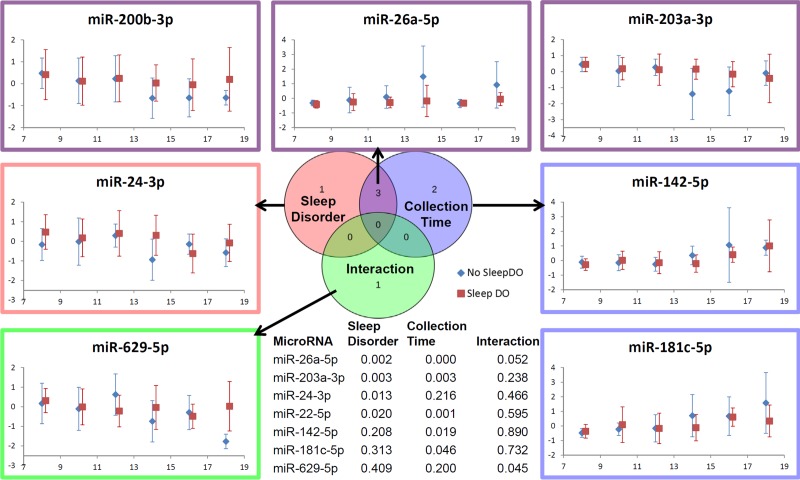
Fig 6. Relationships between CircaMiRs, collection time, and sleep disorder in children with autism spectrum disorder.
A two-way ANOVA was performed to assess the relationship between CircaMiR expression level, collection time, and the presence/absence of disordered sleep in a cohort of 140 children with autism spectrum disorder The Venn diagram (center) shows that 7/14 (50%) of theses CircaMiRs displayed significant relationships with collection time, disordered sleep, or a time-sleep interaction. Mean expression level at 6 time points (8-9AM, 10-11AM, 12-1PM, 2-3PM, 4-5PM, and 6-8PM) is displayed for participants with (red), or without (blue) disordered sleep for each of the 7 CircaMiRs of interest. Two-way ANOVA p-values are listed for each CircaMiR in the embedded table (center, bottom).

