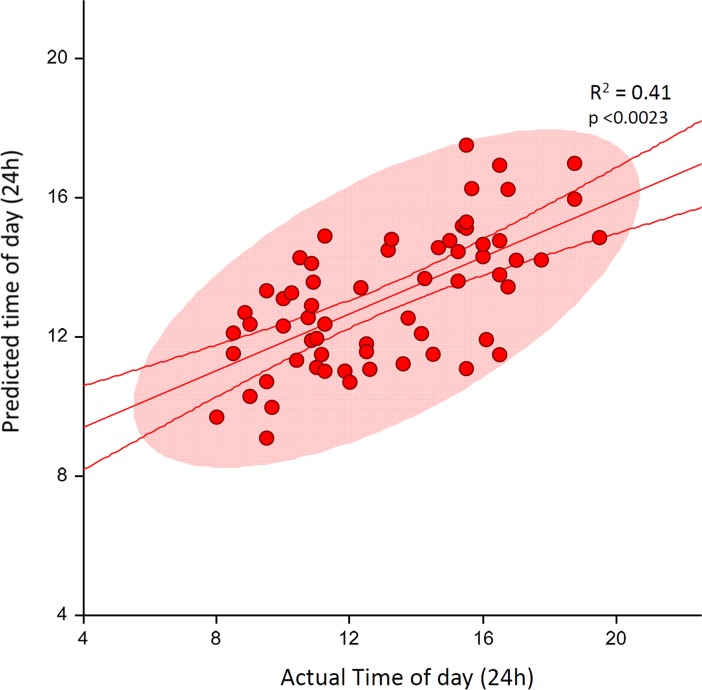
Fig 7. Multivariate regression with CircaMiRs predicts collection time in sample of children with autism spectrum disorder.
The graph plots the relationship between the predicted time and actual time in hours for a subset of 63 autistic children who had normal sleep patterns using 11 CircaMiRs. The lines above and below the regression line indicate the 95th confidence interval of the fitted regression. The colored ellipse represents the 95th confidence interval of the actual data points. Note that there was an absence of a significant relationship in autistic children with a sleep disorder (not shown).

