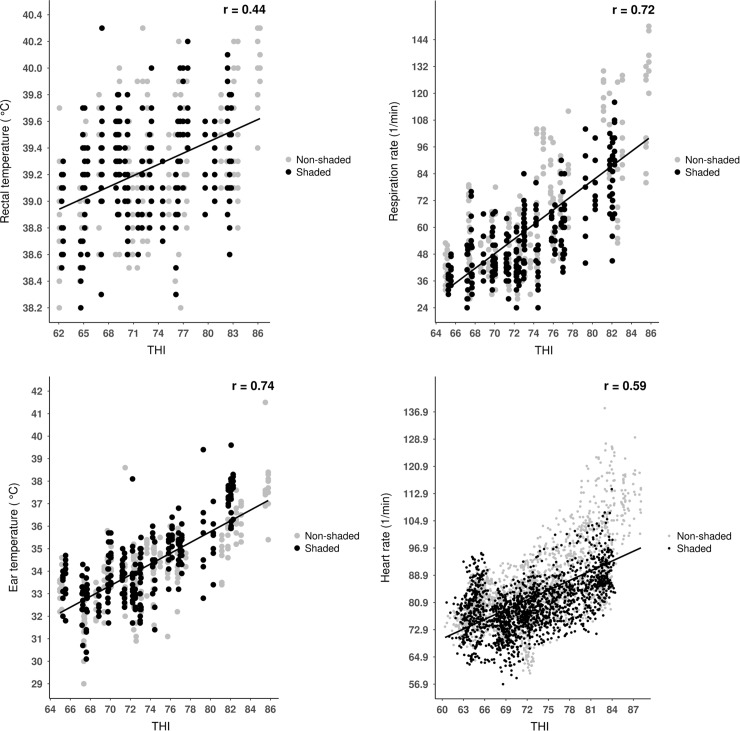
Fig 2. Relationship between rectal temperature, respiratory rate, ear temperature, heart rate and relative humidity in dairy calves.
Points represent individual observations (n = 480 for rectal temperature, ear temperature and respiratory rate; n = 3840 for heart rate) between day 1 0:00 o’clock and day 5 24:00 0’clock; lines represent simple linear regression equations, and ‘r’ represents the correlation coefficient.

