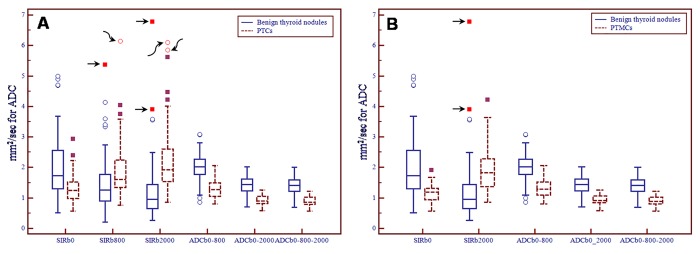
Fig 6.
Boxplot diagrams of significant comparison in diagnostic indicators between thyroid benign nodules and nodules of papillary thyroid microcarcinoma (A, PTCs and B, PTMCs). There are 5 far outside values in the benign thyroid nodules (black arrows) and 3 in the PTCs (curved black arrows) in the 2 Boxplot diagrams. All the 5 far outside values in the benign thyroid nodules are simple nodular hashimoto's thyroiditis. Abbreviations: SIR, signal intensity ratio; ADC, apparent diffusion coefficient; PTCs, papillary thyroid carcinomas; PTMCs, papillary thyroid microcarcinomas.

