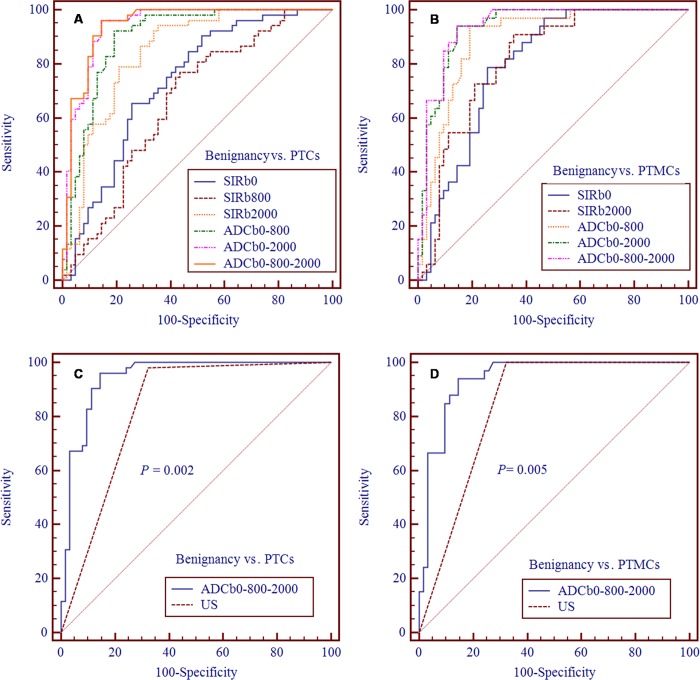
Fig 7.
Comparison of ROC curves between the diagnostic indicators in differentiating thyroid benign nodules from nodules of papillary thyroid microcarcinoma (A, PTCs and B, PTMCs) and comparison of ROC curves between ADCb0-800-2000 and US (C, PTCs and D, PTMCs). Abbreviations: SIR, signal intensity ratio; ADC, apparent diffusion coefficient; PTCs, papillary thyroid carcinomas; PTMCs, papillary thyroid microcarcinomas; US, ultrasound.

